HP Storage Mirroring Software User Manual
Page 55
9 - 5
Connection and Server Display
You can configure when the icons and colors change to accommodate your network environment. For
example, a slow or busy network may need longer delays before updating the icons or colors.
1.
Select
File, Options. On the Configuration tab, you will see Site Monitor and Connection
Monitor. The Site Monitor fields control the icons on the left pane of the Management Console
and the icons on the right pane when a group is highlighted in the left pane. The
Connection
Monitor
field controls the display when a server is highlighted in the left pane. These two
separate monitoring capabilities allow for flexible monitoring.
2.
Under
Site Monitor, specify Check Status Interval to identify the number of seconds between
requests sent from the Management Console to the servers in order to update the display. Valid
values are between
0
and
3600
. The default setting is
30
seconds.
3.
Under
Site Monitor, specify Missed Status Responses to identify the number of responses
from a server that can be missed before the Management Console considers communications
lost and updates the icons. Valid values are between
1
and
100
. The default setting is
2
.
4.
Under
Connection Monitor, specify Missed Status Responses to identify the number of
responses from a server that can be missed before the Management Console considers
communications lost and updates the icons and colors. Valid values are between
0
and
1000
.
The default setting is
5
.
5.
Click
OK to save the settings.
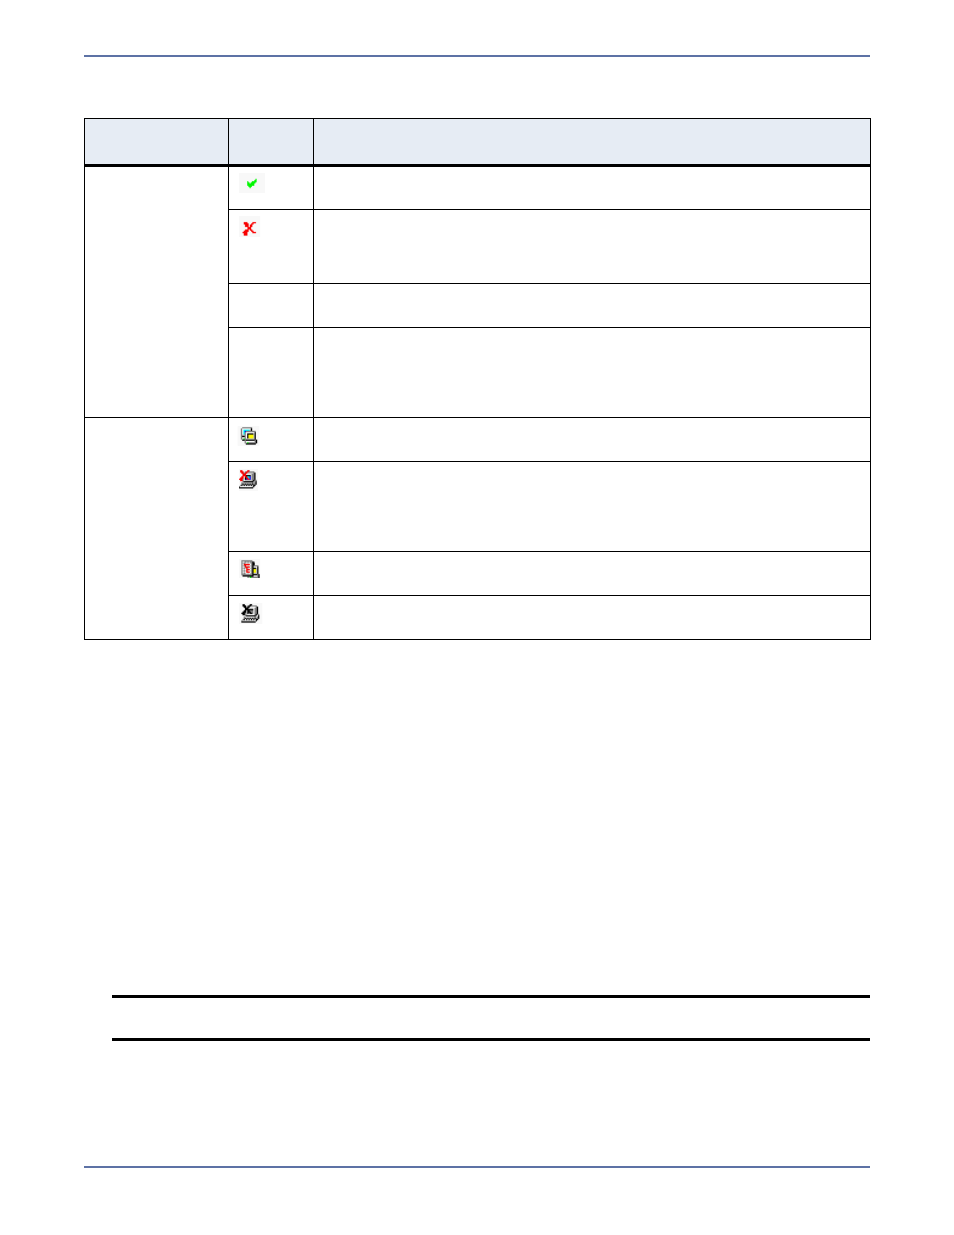
Location
Icon or
Color
Description
Icons and
colors displayed
in the right
pane when a
server is
highlighted in
the left pane
A green checkmark on a connection indicates the connection is
working properly.
A red X on a connection indicates a connection error. For example, an
error may be caused by broken transmission or pending replication.
To determine the exact problem, locate the connection data item that
appears in red.
White
If the connection background is white, the Management Console and
the source are communicating.
Gray
If the connection background is gray, the Management Console and
the source are no longer communicating. The connection data stops
updating once communications have stopped. Once communications
have been reestablished, the connection background will change
back to white.
Left pane icon
An icon with yellow and blue servers indicates a server that is working
properly.
A red X on a server icon indicates the Management Console cannot
communicate with that server or that is a problem with one of the
server’s connections. If the connection background is gray, it is a
communication issue. If the connection also has a red X, it is a
connection issue.
A red tree view (folder structure) on a server icon indicates a restore
is required because of a failover.
A black X on a server icon indicates the server is not running Storage
Mirroring.
NOTE:
If the
Site Monitor and Connection Monitor settings are different, at times, the
icons and color may not be synchronized between the left and right panes.