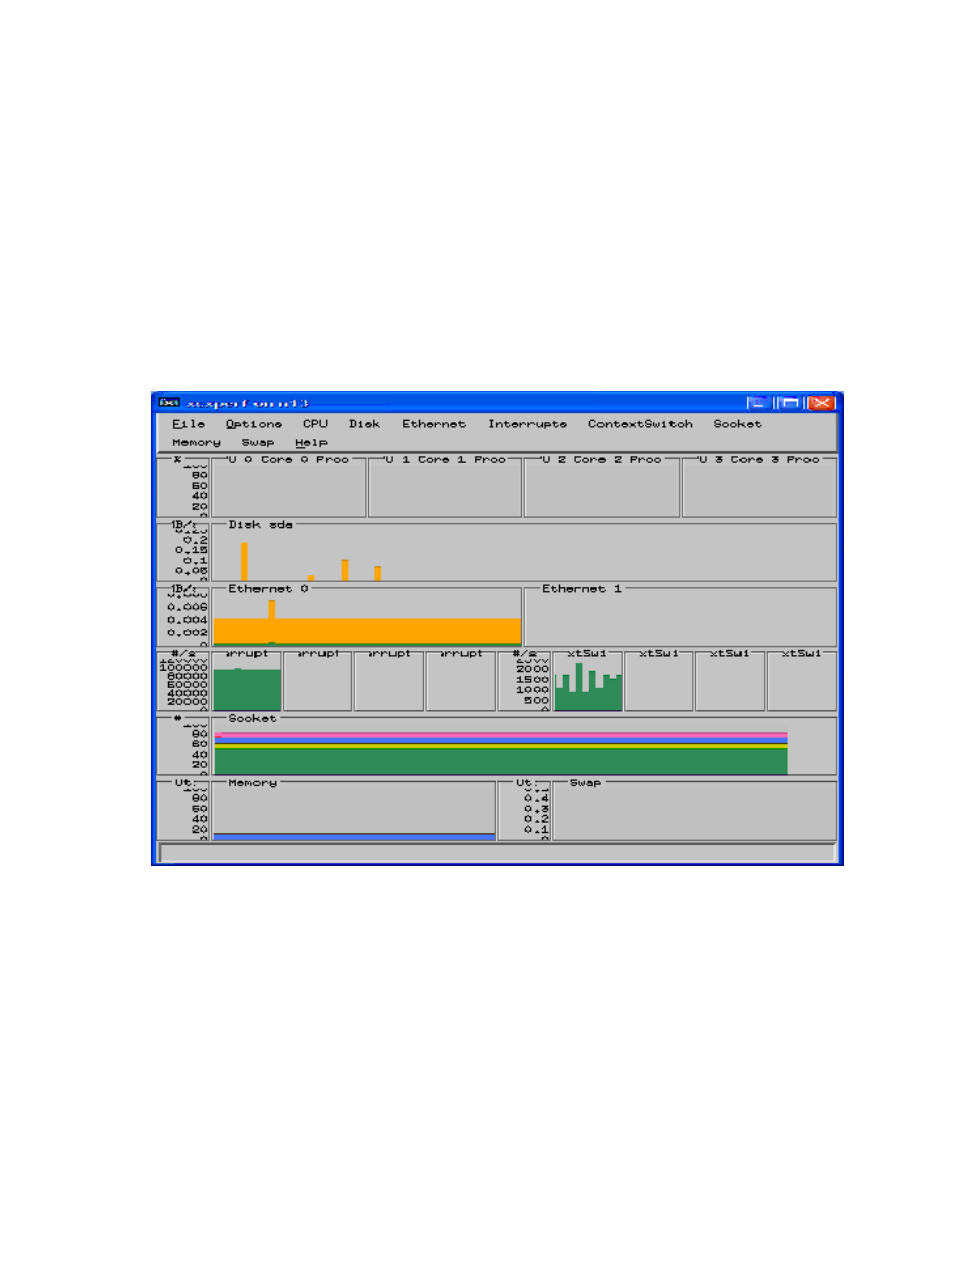
The xcxperf utility display – HP XC System 3.x Software User Manual
Page 78

Use the -node option to specify another node in your allocation, for example, enter the
following to display the performance metrics for node n6:
$ xcxperf -node n6
•
Select a node icon in the xcxclus display.
The xcxperf utility displays a dynamic graph showing the performance metrics for the node.
As shown in
, the statistics are shown in a color-coded histogram. The pull-down
menus at the top of the window describe the color coding for a specific metric.
When you specify the -output (also expressed as -o) option and a prefix, the xcxperf utility
generates a data file for the node it monitors; this data file differs from those generated by the
xcxclus
utility. The following example runs the xcxperf utility and stores the output in a file
named test.xperf:
$ xcxperf -o test
Figure 7-5 The xcxperf Utility Display
Specifying the data file prefix when you invoke the xcxperf utility from the command line
plays back the display according to the recorded data. The following command line plays back
the test.xperf data file:
$ xcxperf test
The following describes the menu options at the top of the xcxperf display window:
Stops the xcxperf utility.
Exit..
File
Enables you to hide or show the CPU, Disk, Ethernet, Interrupts, Socket, or
Memory data.
Hide/Show
Options
Opens an information dialog box that displays system information. See
for an example of this dialog box.
System Information
Displays the color map for core utilization.
CPU
Displays the color map for disk utilization data.
Disk
78
Monitoring Node Activity
