Balloon display in the xcxclus utility – HP XC System 3.x Software User Manual
Page 75
1
The node designator is on the upper left of the icon.
2
The left portion of the icon represents the Ethernet connection or connections.
In this illustration, two Ethernet connections are used. The data for eth0 is above the data
for eth1.
3
The center portion of the icon displays the core usage data for each core in the node.
4
The right portion of the icon displays memory statistics.
5
The arrows at the top of the icon represent Interconnect activity.
NOTE:
In
, the values in the arrows for Interconnect activity are in
terms of percent of utilization. You have the option of displaying either megabytes per
second (rounded up to the next integer) or a percent of utilization.
6
The arrows at the bottom of the icon represent file I/O activity.
NOTE:
In
, the values in the arrows for disk I/O activity are in terms
of megabytes per second, and rounded up to the next integer.
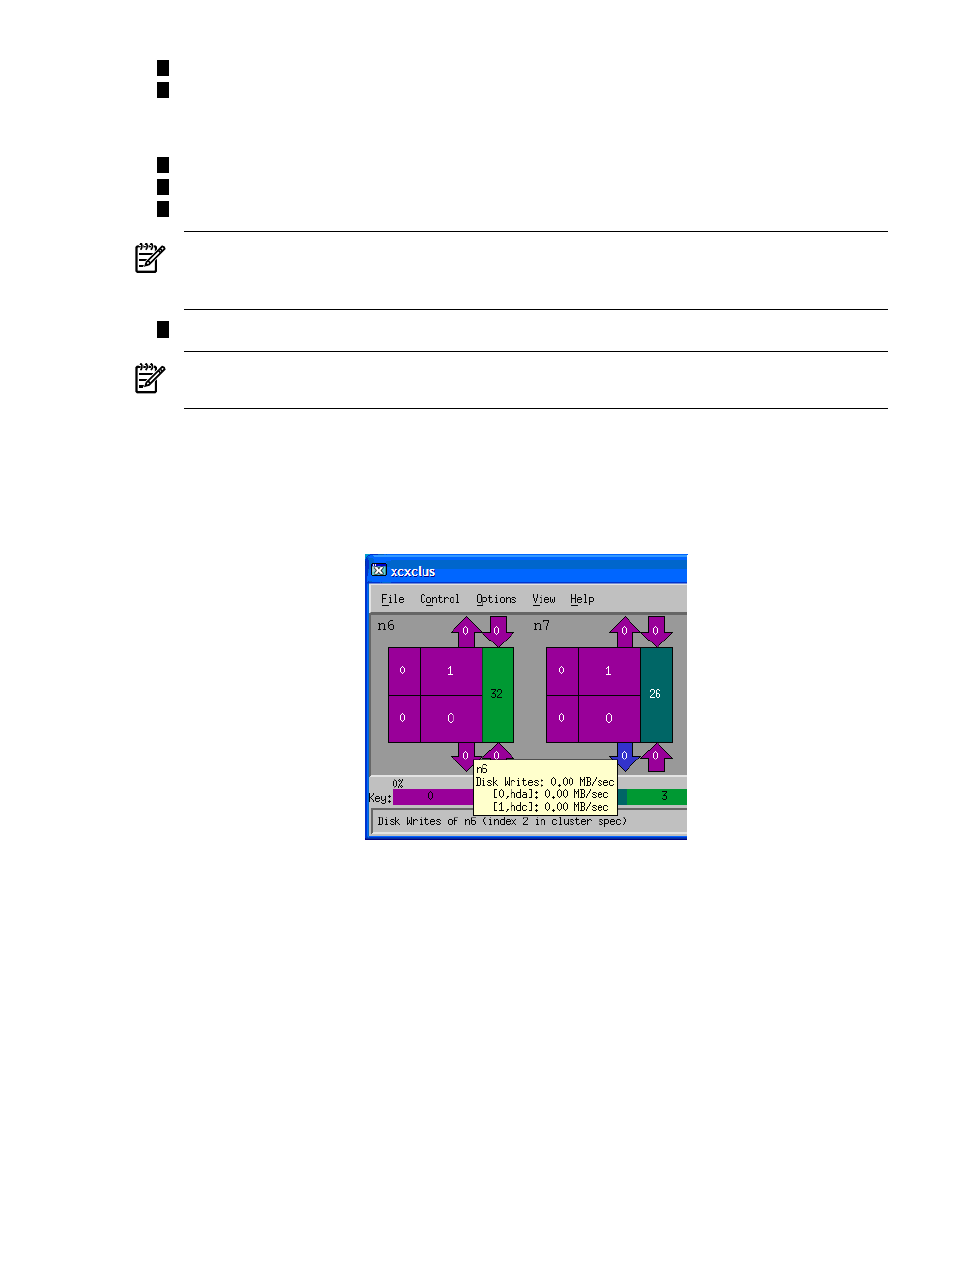
Pointing to the icon with the mouse pointer opens a balloon that displays both the purpose of
that portion of the icon and detailed information corresponding to that area of the icon. This
information is also represented in the status bar at the bottom of the window.
is an
example of this balloon display for Disk I/O writes on node n6.
Figure 7-3 Balloon Display in the xcxclus Utility
The xcxclus utility can generate a data file. The data for each monitored node is updated each
second. You can use this data file either to replay the data or to plot graphs of various node
performance statistics. For more information on plotting graphs with the xcxclus utility, see
“Plotting the Data from the xcxclus Datafiles” (page 76)
.
When you specify the -output option and a prefix, the xcxclus utility generates a data file
for all allocated nodes. The following example runs the xcxclus utility and stores the output
in a file, named test.xclus:
$ /opt/xtools/bin/xcxclus -output test
The following describes the menu options at the top of the xcxclus display window:
Stops the xcxclus utility.
Exit..
File
Opens a dialog box that enables you to set the refresh rate.
Refresh...
Options
Opens a dialog box that enables you to change the utilization to color
mapping for all components.
Modify Key...
7.2 Using the xcxclus Utility to Monitor Nodes
75