5 plotting the node performance data, Xcxperf system information dialog box – HP XC System 3.x Software User Manual
Page 79

Displays the color map for the data on interrupts.
Ethernet
Displays the color map for the data on interrupts.
Interrupts
Displays the color map for the data on context switches data.
ContextSwitch
Displays the color map for the data on sockets.
Socket
Displays the color map for the memory data.
Memory
Displays the color map for the swap data.
Swap
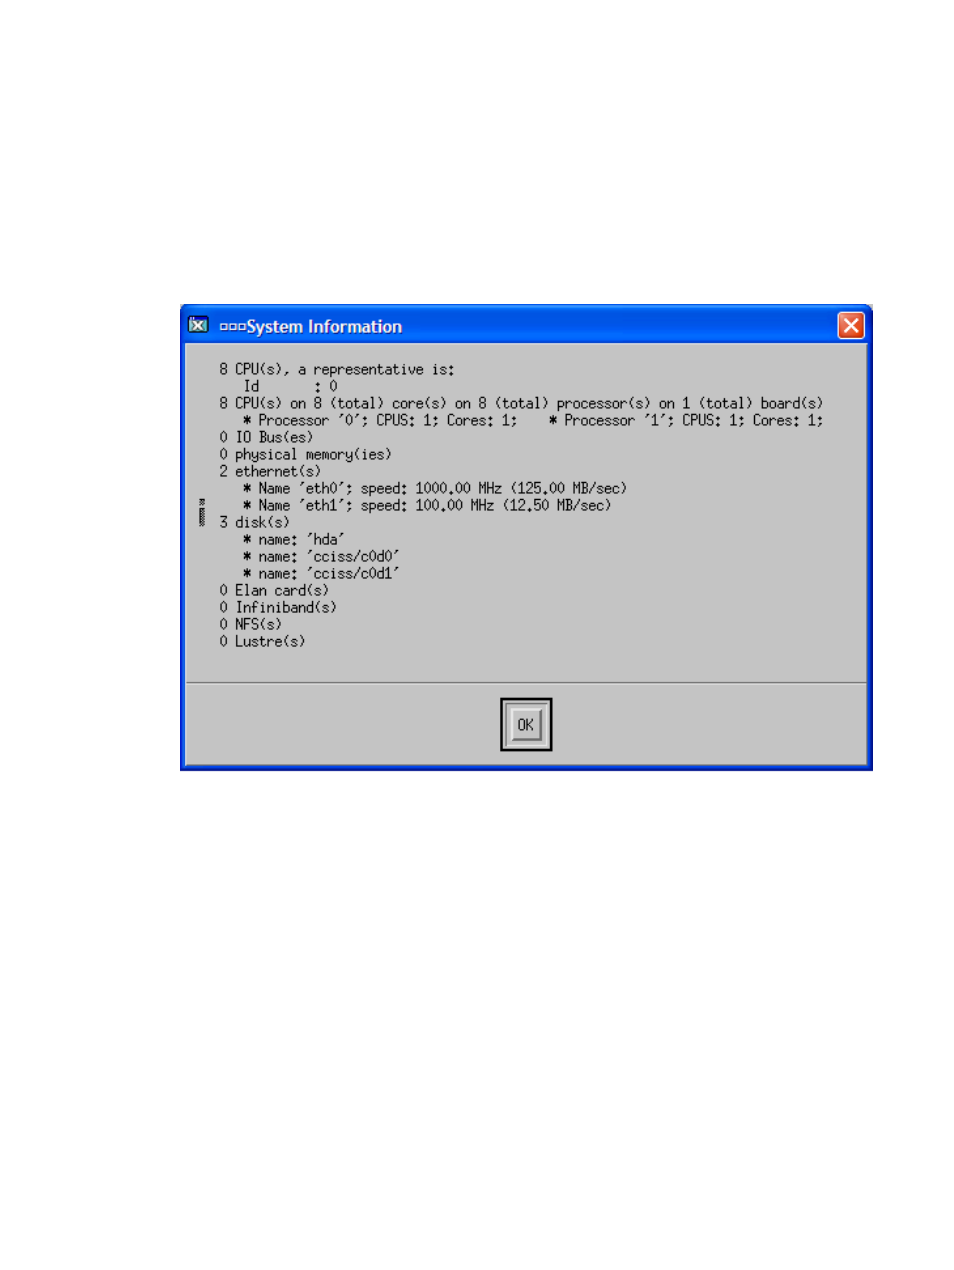
is an example of the dialog box that you can open to list system information.
Figure 7-6 xcxperf System Information Dialog Box
For additional information about this utility, see xcxperf(1).
7.5 Plotting the Node Performance Data
The xcxperf utility enables you to graph the data from the datafiles generated with its -output
option.
is a representation of the plotted output for the DB.n6.xperf data file, which
was created and plotted with the following commands:
$ /opt/xtools/bin/xcxperf DB.n6
$
$ /opt/xtools/bin/xcxperf -plot pfile DB.n6
Do you wish to view the created plots now using the command
$.../bin/gnuplot pfile.xperf.gnuplot (y/[n])? y
Node n6 is one of the nodes in the job allocation. You need to specify a plot file (pfile in this
example) to contain the plot data.
is an example of the plotted output from the xcxperf utility.
7.5 Plotting the Node Performance Data
79
