Graphing metrics – HP 2000SA G2-Modular-Smart-Array User Manual
Page 28
5.
In the Create Performance Graph pop-up window, enter the following metrics:
NOTE:
Available metrics vary, depending on the Statistics Group chosen. For a complete
listing of the options, see
a.
Select Statistics Group (controllers, host ports, vdisks, volumes, or disks)
b.
Select Objects (specific controllers, host-ports, vdisks, volumes, or disks)
c.
Select Metrics (group or individual)
d.
Customize the graph (name and description)
e.
Click Submit.
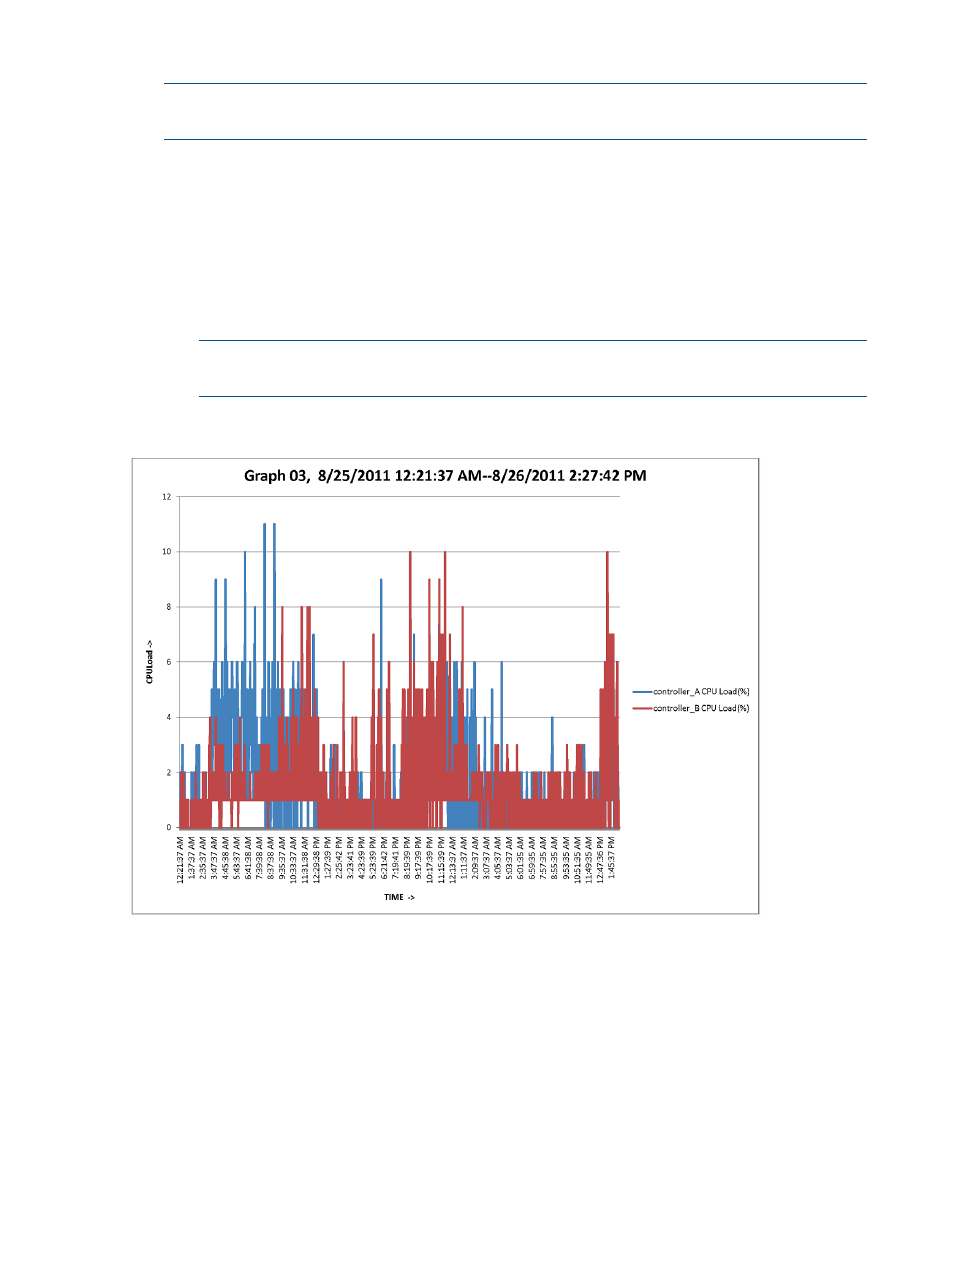
After a moment, the graph is displayed, followed by a completion message that includes
the file location of the Excel graph and other saved data. Files are stored in subfolders
at the following location: C:\HP\msa\datamodel\.
NOTE:
If desired, the saved graphs and other collected data can be manipulated further,
using Excel and other third-party software tools.
The following graph is an example of controller CPU Load for the time period of the collection.
Graphing metrics
The following tables list all metrics available for graphing, based on the statistics group chosen
(controllers, host-ports, vdisks, volumes, or drives). Minimum required P2000 G3 MSA controller
firmware version is indicated.
28
HP P2000 MSA Performance Tool