Graph scaling, 4 graph scaling, Autoscale minimum – ROTRONIC MBW 473 User Manual
Page 22
18
MBW473_MANUAL_E_V2.0
4.4 Graph Scaling
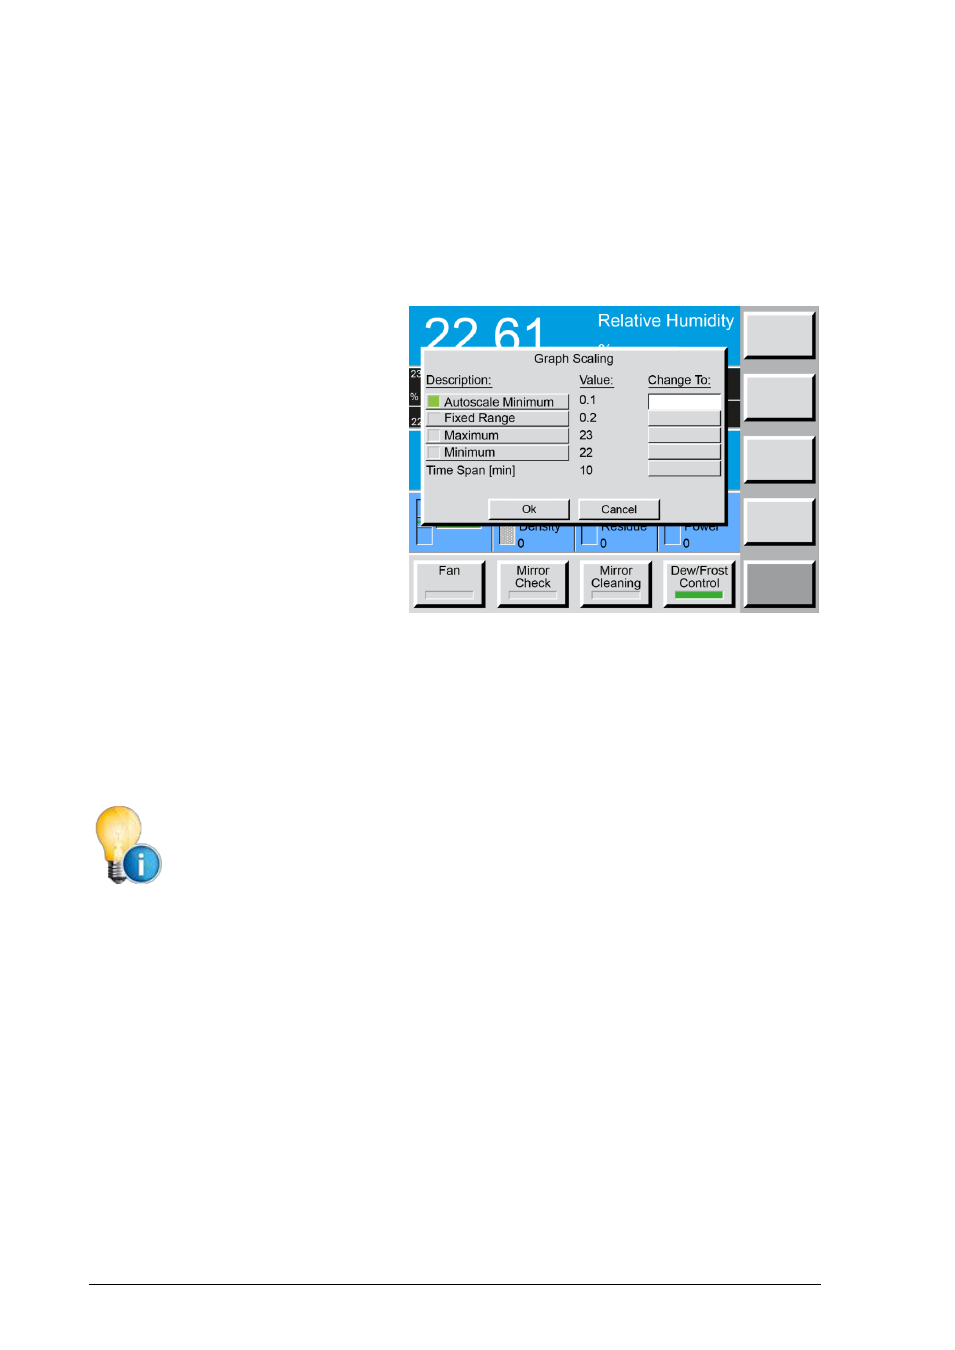
Each graph can have its own x and y-axis scaling and range settings. There are three different scaling
modes to choose from; Autoscale Minimum (which is the default setting), Fixed Range or Mini-
mum/Maximum. Each of these is explained in more detail below. You can change the graph scaling
and switch between the three scaling modes at any time.
1. On the screen, touch the graph you
wish to change. A graph scaling dia-
log box will appear. One of the but-
tons in the Description column will
have a green indicator. This shows
you the currently selected mode.
2. If you would like to change the scal-
ing mode, touch the button of the
mode you would like to select. Note
that for the Minimum/Maximum op-
tion, only the Maximum button needs
to be selected (the Minimum is then
automatically selected by the sys-
tem).
3. Touch the corresponding field in the Change To column, next to the range that you have selected.
4. Using the numerical keypad, enter the value needed. If you make a mistake while entering the
value, touch the field you are editing on the screen. With each touch, the last digit in the field will
be erased.
5. Once you have entered the correct value, press the Ok button (or the enter key on the numeric key-
pad) to confirm. Press the Cancel button if you wish to abort all changes made in the dialog box.
Any values you enter will only be accepted by the system if they correspond with the
selected mode. If, for example, you enter a value into the bracket next to the
Autoscale Minimum, but Fixed Range is the selected mode, the Autoscale Minimum
value will remain unchanged.
Autoscale Minimum
The Autoscale Minimum mode is the default setting for this instrument. This mode sets the scaling
automatically so that all of the stored data will be visible on the graph at the best possible resolution.
As the range of the data changes, so will the range of the graph. In Autoscale Minimum mode, you
can select the minimum range that you want the graph to scale to. For viewing temperature and dew
or frost point graphs, setting the Autoscale Minimum to a value of 0.1 or greater is generally a good
choice. It allows the graph range to close in on the data as it stabilizes at a single value without the
range of the y-axis becoming too narrow.
For example, setting an Autoscale Minimum of 0.1 while the 473 is displaying a graph of a steady dew
point measurement of 20.0 °C will set the minimum and maximum value limits of the graph to 19.95 °C
and 20.05 °C, respectively. The graph will also zoom out as needed if a reading goes outside that
range. You can experiment with this value to determine your personal preference.