2 line chart, 1 how the line chart is used, Line chart -20 – IDEC High Performance Series User Manual
Page 692: How the line chart is used -20, 2line chart
2 Line Chart
11-20
WindO/I-NV2 User’s Manual
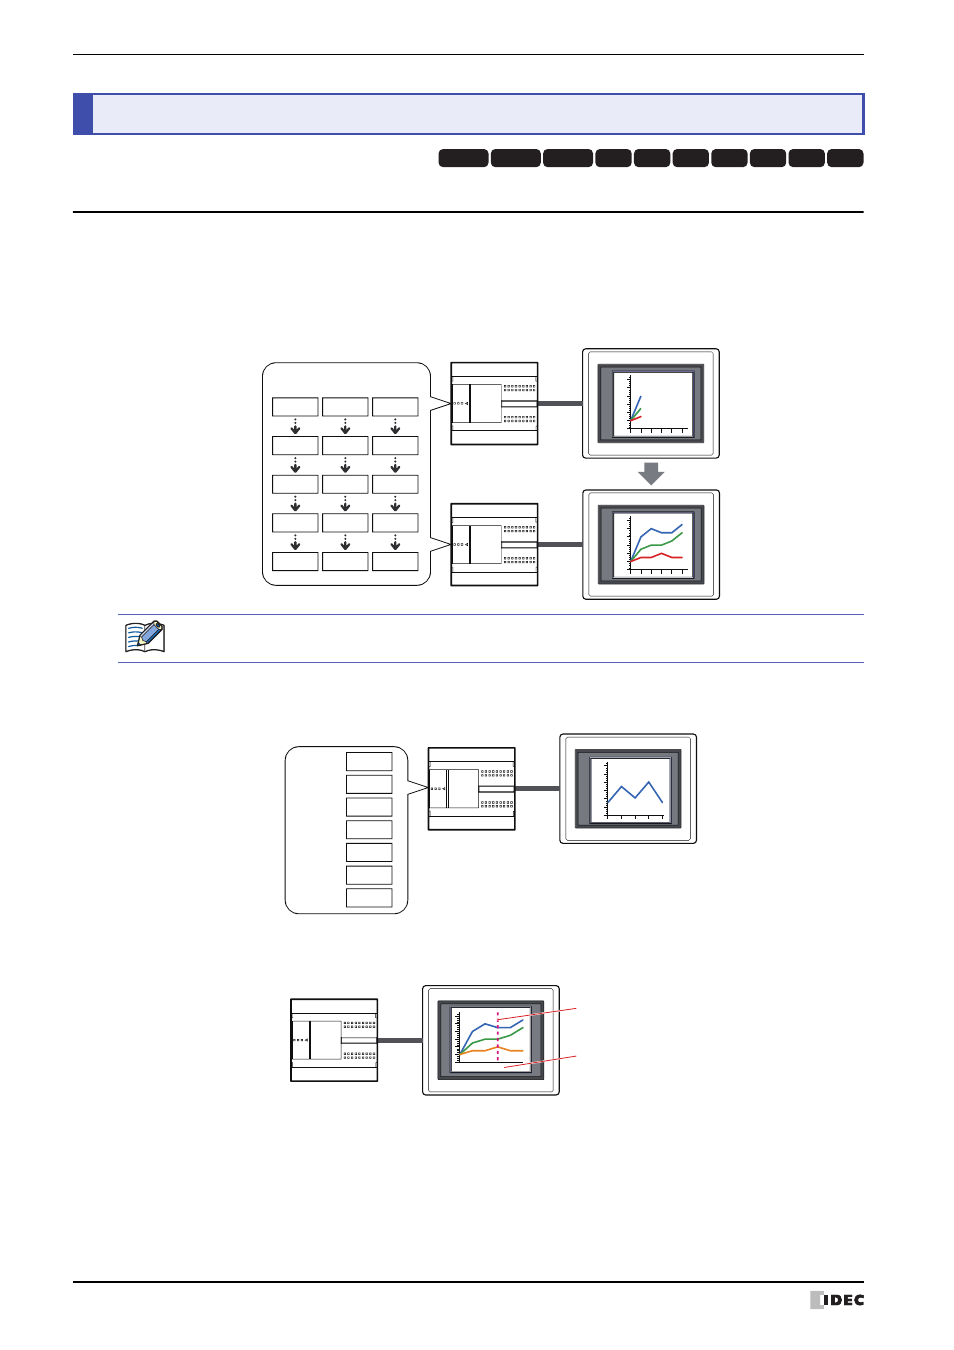
2.1 How the Line Chart is Used
The line chart can be used to display device values sampled with the Data Log function and the values of multiple
word devices.
• Display the device values sampled with the Data Log function in a trend chart
• Display the values of multiple, continuous devices in a single line chart
• Display the cursor and the date and time at the cursor
2
Line Chart
HG3G
HG2G-5F
HG2G-5S
HG2G-S
HG4G HG1F HG2F HG2S HG3F HG4F
Host
MICRO/I
D100
60
80
70
70
90
D101
30
40
40
50
70
D102
10
10
20
10
10
0
20
40
60
80
100
-20
0
20
40
60
80
100
-20
• There are two types of trend charts, a normal trend chart and a pen recorder trend chart.
• If the Data Log data displayed in the chart is deleted, the chart display is erased.
Host
MICRO/I
D100
:
1
D101
:
5
D102
:
10
D103
:
50
D104
:
20
D105
:
60
D106
:
10
0
20
40
60
80
100
-20
Host
MICRO/I
11/10/01
12:01:30
Cursor
Date and Ɵme
at the cursor