Figure 2, Main screen test and live panel, Ratamation v2.0 user manual perma pure llc – Perma Pure RATAMATION V2.0 User Manual
Page 7
RATAmation v2.0 User Manual
Perma Pure LLC
Phone (732) 244-0010
www.permapure.com
Sept. 2012
5
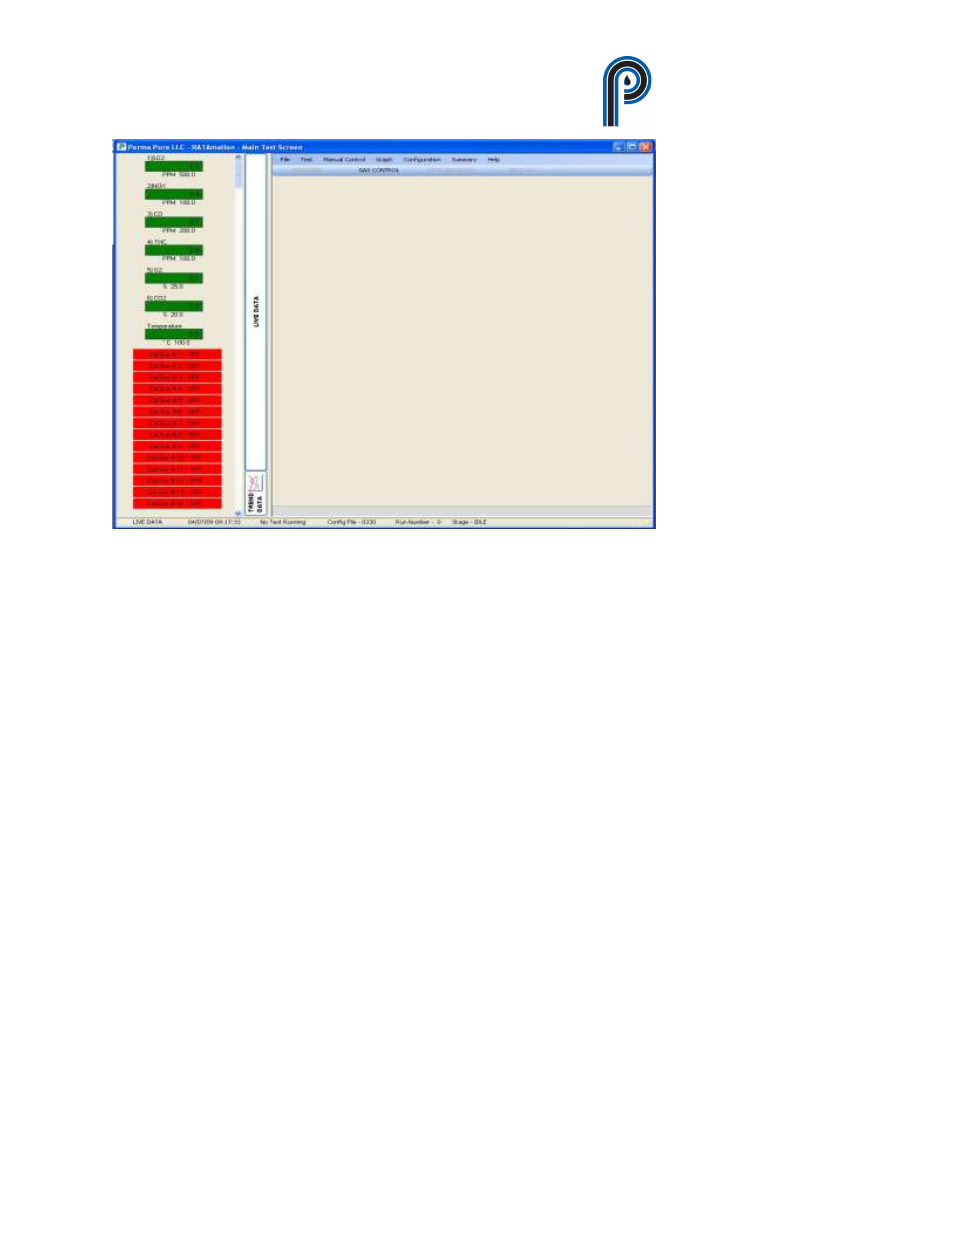
Figure 2
The Main screen with the Graph Panel opened allows the operator to view the historical data that
has been recorded for the test. The Graph Panel data is displayed for each analyzer as 0 to 100%.
The graph displays an hour of data with the newest data toward the right and can be scrolled to
view all data. The graph contains a total of up to 7 days of data, With data stored to disk after
every 15 second average.
Clicking the button labeled “TREND DATA” (Figure 2) will display or hide the panel. The
Graph Panel height can be adjusted and the size of the graph adjusts to fill the available space of
the panel.