Experiment 9: apparent depth – PASCO OS-8459 Beginning Optics System User Manual
Page 46
®
B e g i n n i n g O p t i c s S y s t e m
T e a c h e r ’ s G u i d e
46
Experiment 9: Apparent Depth
Typical results:
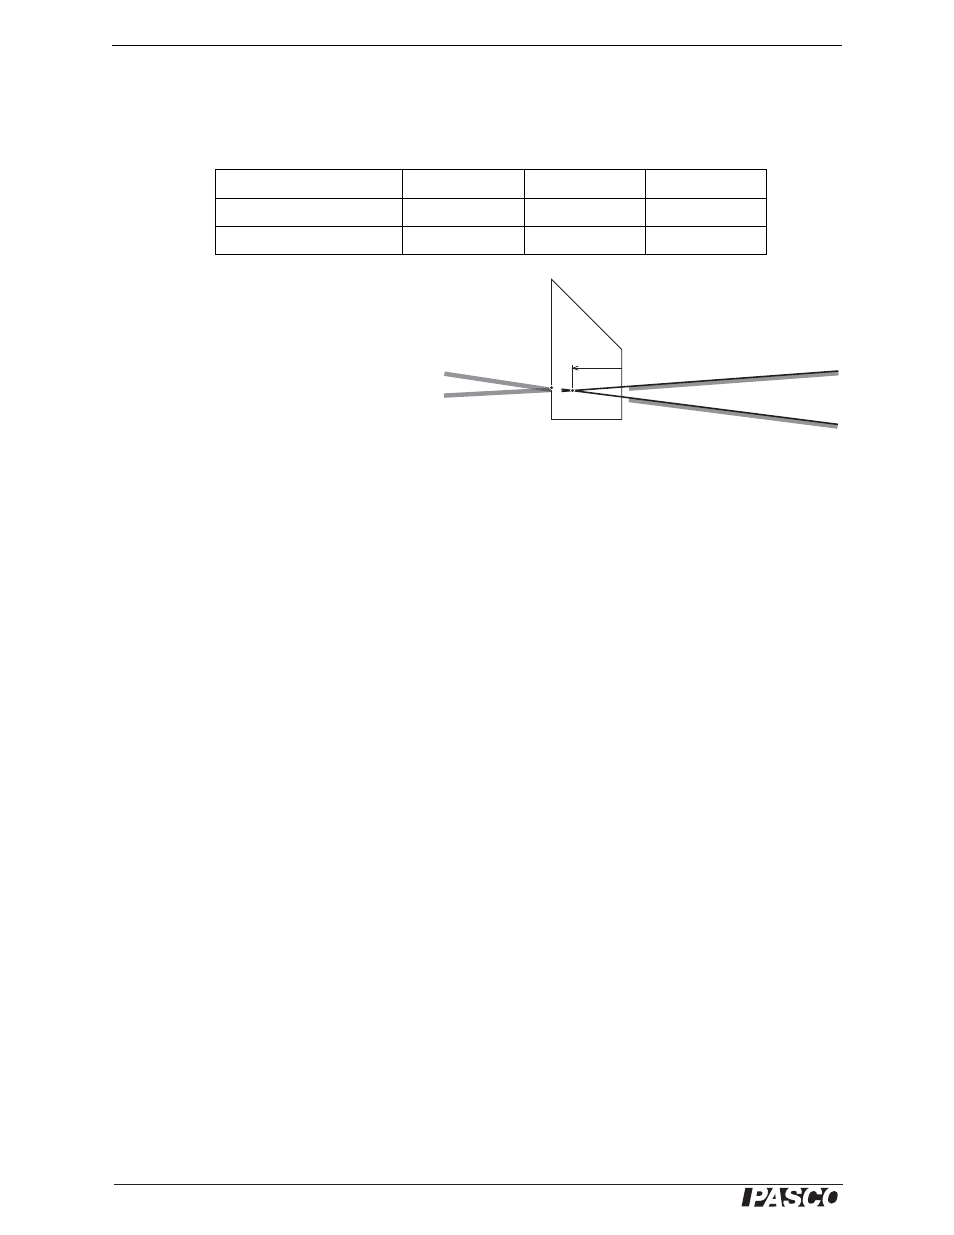
Typical ray-tracing results are represented at
50% scale in Figure TG.1. The gray regions
represent the actual light beams; the black
lines and dots represent the student’s actual
marks. Notice that this student traced along the
edges of the light beams.
The actual thickness of the rhombus is
t = 3.175 ± 0.025 cm. Based on the accepted
value of n = 1.49, the theoretical apparent
depth is d = 2.13.
Answers to questions:
1. Of the two methods, the parallax method is the more precise. Using that method,
both d and t could be measured with a precision of less than 1 mm. Using the ray-tracing method, the points at
which the rays crossed had a larger uncertainty due to the thickness of the light beams. 2. For the typical data
above, the percent differences between the accepted and experimental values of n are 0.7% for Part 1 and 5% for
Part 2.
Experiment 10: Focal Length and Magnification of a Thin Lens
Note on equipment:
Provide students with the +100 mm mounted lens. Cover the focal length indicated on
the label. Other converging lenses will work, but you may have to modify the light source-to-screen values given
in Table 10.1.
Part 1:
For a distant object, 1/d
o
approaches zero, therefore the image will form clearly with a lens-to-screen
distance of d
i
= f ≅ 10 cm.
Table 1.1: Results
d
t
n
Part 1: Parallax method
2.12 cm
3.18 cm
1.50
Part 2: Ray-tracing method
2.23 cm
3.18 cm
1.43
2.23 cm
Figure TG.1