Method ii: measurement by equilibrium positions, Time, Theory – PASCO AP-8215A Gravitational Torsion Balance User Manual
Page 15: Procedure, Analysis
®
M o d e l N o . A P - 8 2 1 5 A
M E T H O D I I : M e a s u r e m e n t b y E q u i l i b r i u m P o s i t i o n s
11
METHOD II: Measurement by Equilibrium Positions
Observation Time: ~90+ minutes
Accuray: ~5%
Theory
When the large masses are placed on the swivel support and moved to
either Position I or Position II, the torsion balance oscillates for a time
before coming to rest at a new equilibrium position. This oscillation can be
described by a damped sine wave with an offset, where the value of the off-
set represents the equilibrium point for the balance. By finding the equilib-
rium point for both Position I and Position II and taking the difference, the
value of
S can be obtained. The remainder of the theory is identical to that
described in Method I.
Procedure
1. Set up the experiment following steps 1–3 of Method I.
2. Immediately after rotating the swivel support to Position II, observe the light spot. Record the position of the
light spot (S) and the time (t) every 15 seconds.Continue recording the position and time for about 45 min-
utes.
3. Rotate the swivel support to Position I. Repeat the procedure described in step 2.
Note: Although it is not imperative that step 3 be performed immediately after step 2, it is a good idea to proceed
with it as soon as possible in order to minimize the risk that the system will be disturbed between the two mea-
surements. Waiting more than a day to perform step 3 is not advised.
Analysis
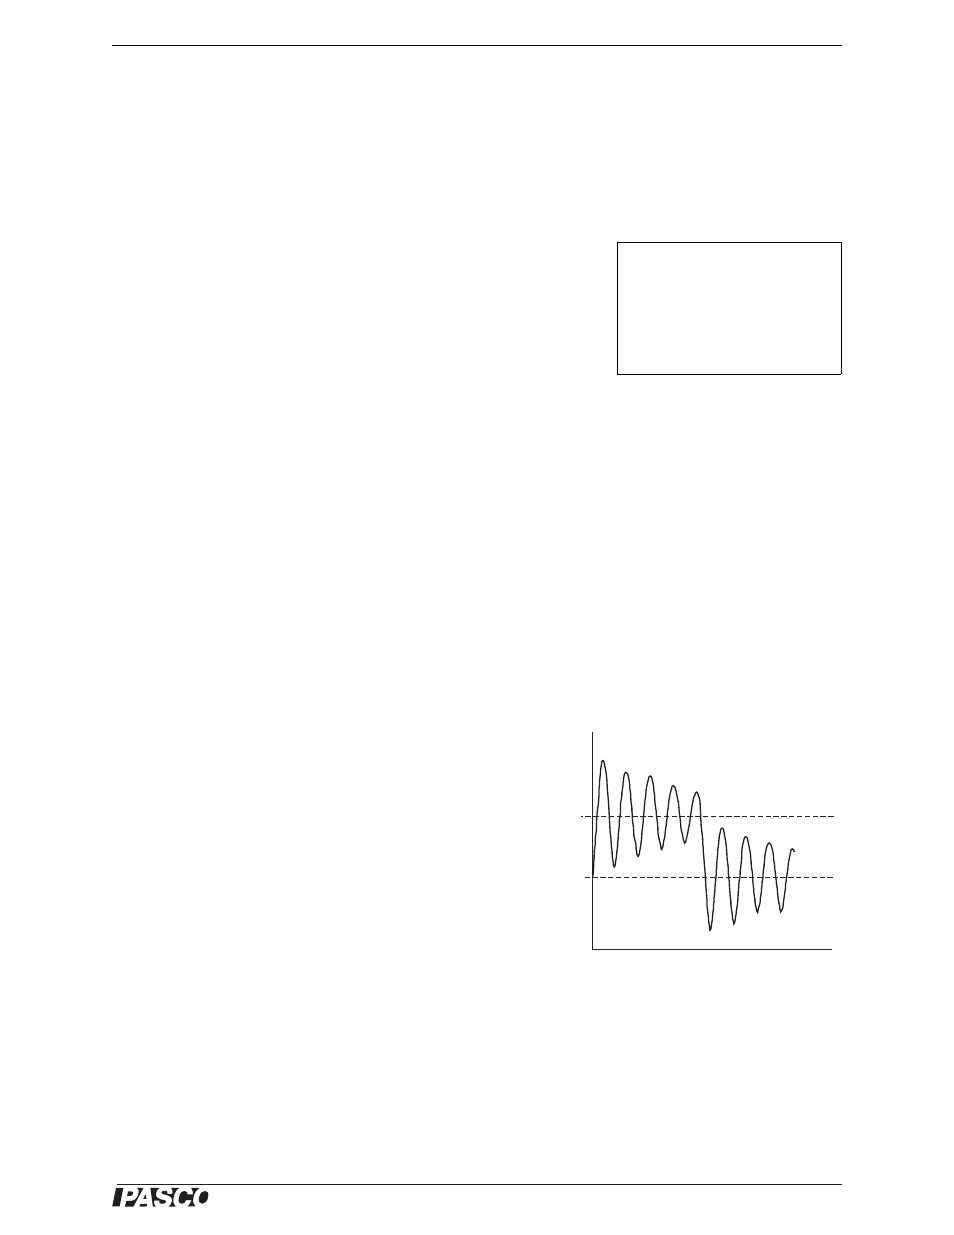
1. Construct a graph of light spot position versus time for
both Position I and Position II. You will now have a
graph similar to Figure 18.
2. Find the equilibrium point for each configuration by
analyzing the corresponding graphs using graphical
analysis to extrapolate the resting equilibrium points S
1
and S
2
(the equilibrium point will be the center line
about which the oscillation occurs). Find the difference
between the two equilibrium positions and record the
result as
S.
3. Determine the period of the oscillations of the small
mass system by analyzing the two graphs. Each graph
will produce a slightly different result. Average these
results and record the answer as T.
4. Use your results and equation 1.9 to determine the value of G.
5. The value calculated in step 4 is subject to the same systematic error as described in Method I. Perform the
correction procedure described in that section (Analysis, step 3) to find the value of G
0
.
Note: To obtain an accuracy of 5%
with this method, it is important to
use graphical analysis of the posi-
tion and time data to extrapolate the
resting equilibrium positions,
S
1
and S
2
.
60
S
(cm)
Time
(min)
S
2
S
1
0
20
Figure 18: Typical pendulum oscillation pattern
showing equilibrium positions.