Measurement types – Atec Acterna-JDSU-ANT-20SE User Manual
Page 5
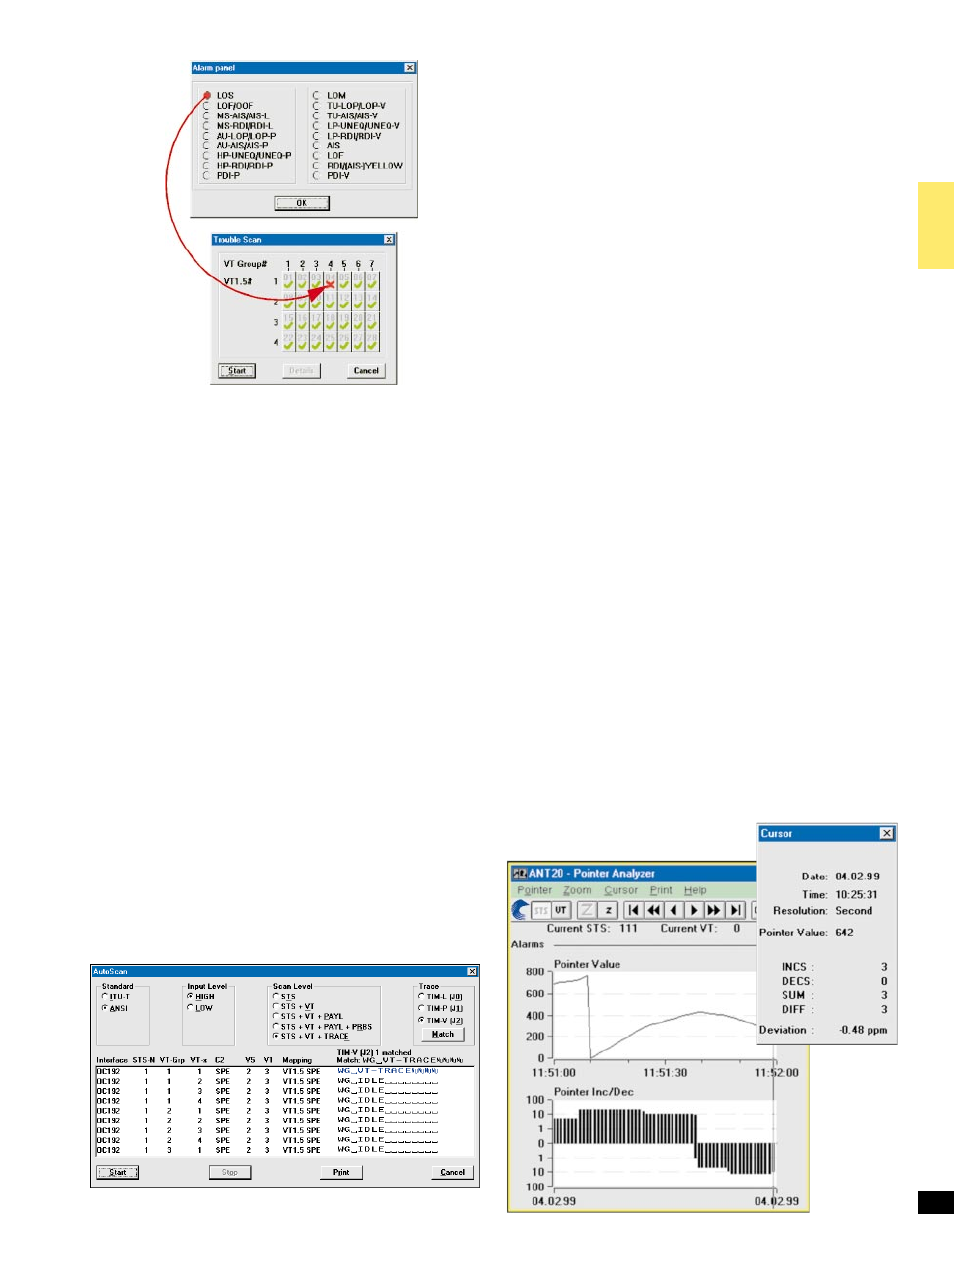
Automatic TROUBLE SCAN function
(Figure 2)
The TROUBLE SCAN function permits sequential testing of all VT1.5
or VT2 channels in a SONET signal. The ANT-20SE receiver checks for
alarms in the receive signal, the SONET structure and all channels.
The results (OK/not OK) for each channel are entered in a matrix.
A detailed alarm history can be displayed by selecting a channel from
the matrix.
Only the receive channels are switched during a TROUBLE SCAN.
AutoScan function
(Figure 3)
This automatic ªAutoScanº function allows you to rapidly check the
signal structure, the mapping used, the trace identifier and the payload
± even with mixed mapped signals.
The ANT-20SE receiver analyzes the incoming received signal and pro-
vides a clear overview of all the signals present in the composite receive
signal. The variable scan depth setting allows even complex signal
structures to be resolved and displayed clearly. All the displayed results
can be printed out.
Automatic SEARCH function
Channel shifts in the payload may occur when measuring complex net-
work elements, depending on the configuration of the device under
test. The SEARCH function permits rapid automatic location of the
test channel (VT1.5 or VT2 with defined PRBS) in the payload of a
SONET signal.
The ANT-20SE receiver checks for alarms in the receive signal, the
SDH structure and all channels, and for synchronization of the selected
test pattern in all channels. The results (OK/not OK) for each channel
are entered in a matrix.
An OK result indicates that the corresponding channel contains the
signal searched for. Only the receive channels are switched during a
SEARCH.
Measurement types
Error measurements
Error types . . . . . . . . . . . . . . . . . . . . . . . . . . . . . B1, B2, B3 parity errors,
frame errors, REI-L, REI-P,
bit errors in test pattern, BPV
Additionally, for
DS1 . . . . . . . . . . . . . . . . . . . . . . . . . . . . . . . . . . . . . . . . . . . . . CRC errors
DS3 . . . . . . . . . . . . . . . . . . . . . . P-parity errors, CP-parity errors, FEBE
Error Count, Error Rate, Intermediate Errors
Performance analysis
ES, SES, EFS, SEFS, UAS are evaluated
In-service measurements (ISM)
Simultaneous ISM of the near-end and far-end of a selected path
± Near-end . . . . . . . . . . . . . . . . . . . . . . . B1, B2, B3, BIP-V, CRC-6
± Far-end . . . . . . . . . . . . . . . . . . . . . . . . . . . . REI-L, REI-P, REI-V
DS1, DS3 events . . . . . . . . . . . . . . . . . . . . . F bit, parity, FEBE, C parity
Out-of-service measurements (OOS)
OOS evaluation using bit errors in test pattern
Analysis of STS-1 and VT pointer actions
(Figure 4)
Display of
± Number of pointer operations:
Increment, Decrement, Sum (Increment + Decrement),
Difference (Increment ± Decrement)
± Pointer value
Clock frequency measurement
The deviation of the input signal clock frequency from the nominal
frequency is displayed in ppm.
5
Figure 3: AutoScan.
Figure 4: Graphic pointers. Display showing additional evaluation
of cursor position.
Figure 2: Trouble scan.