Jitter analysis – Atec Acterna-JDSU-ANT-20SE User Manual
Page 15
Measuring modes . . . . . . . . . . . . . . . . . . . . . . . . . . . . see Jitter Analysis
Demodulator outpur
75 O, BNC socket
Output voltage
Meas. range I (0 to 2 UIpp) . . . . . . . . . . . . . . . . . . . . . . . . . . 1 V/UIpp
Meas. range II (0 to 32 UIpp) . . . . . . . . . . . . . . . . . . . . . 62.5 mV/UIpp
Automatic tests . . . . . . . . . . . . . . . . . like jitter meter up to 622 Mbit/s
Tolerance masks at
MTJ/F-MTJ . . . . . . . . . . . . . . . . . . ANSI T1.105.03, Telcordia GR-253,
ITU-T G.825
JTF . . . . . . . . . . . . . . . . . . . Telcordia GR-253, ANSI T1.105.03 type A,
ITU-T G.958
Wander Generator
Fully complies with or exceeds the requirements
of ITU-T O.172
Amplitude range. . . . . . . . . . . . . . . . . . . . . . . . . . . . . . up to 200 000 UI
Frequency range . . . . . . . . . . . . . . . . . . . . . . . . . . . . . . 10 mHz to 10 Hz
Accuracy . . . . . . . . . . . . . . . . . . . . . . . . . . . . . . . . . . . . . . . . as per O.172
Resolution . . . . . . . . . . . . . . . . . . . . . . . . . . . . . . . . . . . . . . . . . . . 1 mHz
Wander Analyzer
Other sampling rates in addition to the 30/s rate are
available for detailed analysis versus time:
Sampling rate ± Low-pass filter ±
Test duration . . . . . . . . . . . . . . . . . . . . . . . . . . . . . 1/s - 0.1 Hz - 99 days
30/s - 10 Hz - 99 h
60/s - 20 Hz - 99 h
300/s - 100 Hz - 5000 s
Amplitude range . . . . . . . . . . . . . . . . . . . . . . . . . . . . . .+1 ns to +10
6
s
Measurement accuracy . . . . . . . . . . . . . . . . . . . . . . . . . . . . as per O.172
Evaluation capabilities
see Wander Analysis
Reference signal input
75 O, BNC socket
Frequencies . . . . . . . . . . . . . . . . . . . . . . . . . . . . 1.544, 2.048, 5, 10 MHz
Input voltage . . . . . . . . . . . . . . . . . . . . . . . . . . . . . . . . . . . . 0.5 to 5 Vpp
Input signal monitoring
(Loss of Timing Input). . . . . . . . . . . . . . . . . . . . . . . . . . . . . . . . . . . . . LTI
Accessory: ªStandard Frequency Sourceº for wander applications, see
end of chapter
Jitter Analysis
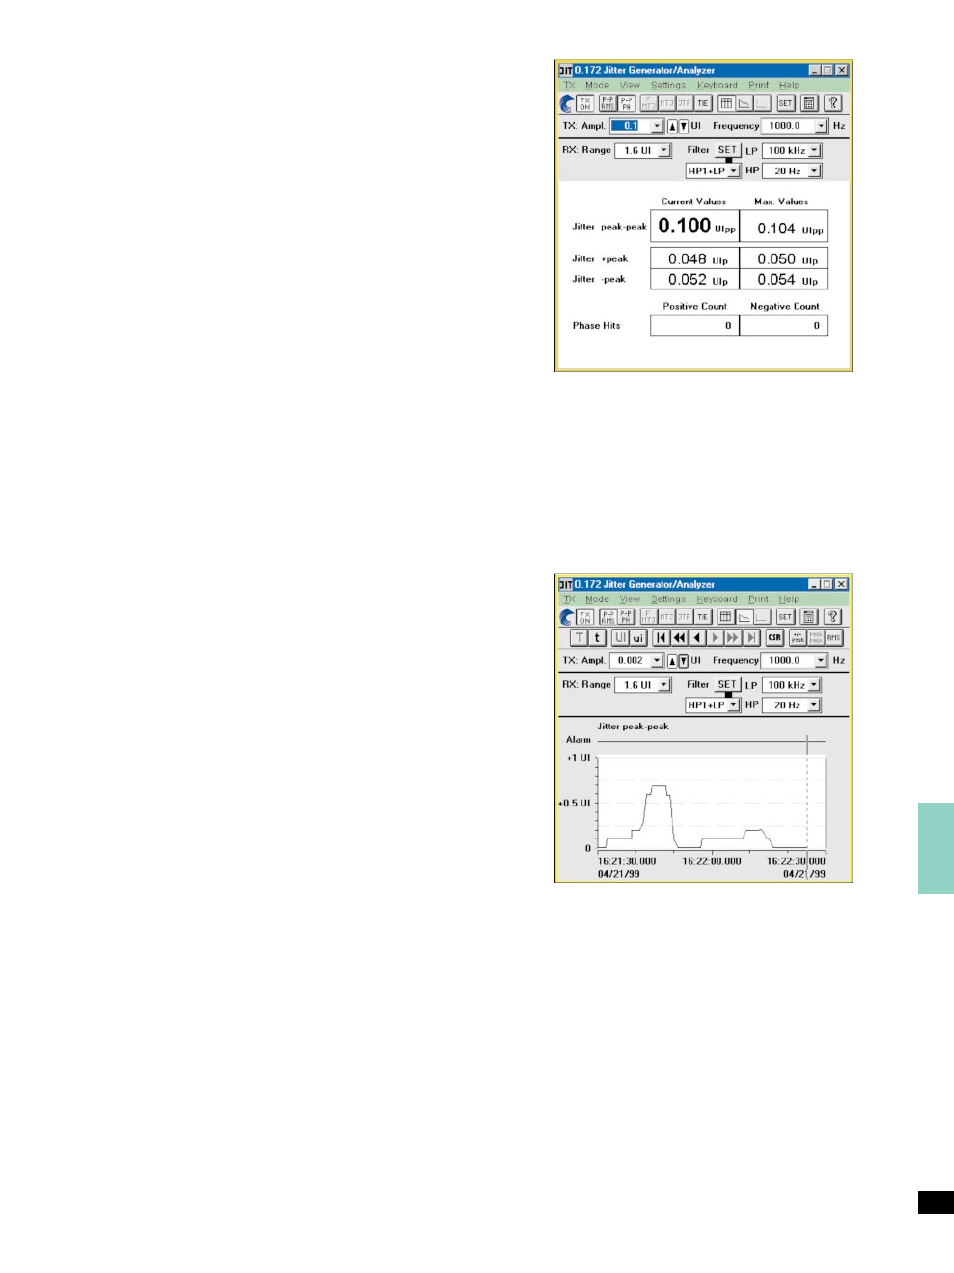
Current values (continuous measurement)
Peak jitter value . . . . . . . . . . . . . . . . . . . . . . . . . . . . . . . . . . . . . . in UIpp
Positive peak value . . . . . . . . . . . . . . . . . . . . . . . . . . . . . . . . . . in UI+p
Negative peak value . . . . . . . . . . . . . . . . . . . . . . . . . . . . . . . . . . in UI±p
Maximum value (gated measurement)
Maximum peak jitter value . . . . . . . . . . . . . . . . . . . . . . . . . . . . . in UIpp
Maximum positive peak value . . . . . . . . . . . . . . . . . . . . . . . . . in UI+p
Maximum negative peak value . . . . . . . . . . . . . . . . . . . . . . . . . in UI±p
Result averaging (switchable) . . . . . . . . . . . . . . . . . . . . . . . . . . . 1 to 5 s
The ANT-20SE retains phase synchronicity even when pointer jitter
occurs (phase tolerance to O.172).
Phase hits
The instrument detects when the programmable threshold for positive
and negative jitter values is exceeded.
The result indicates how often this threshold was exceeded.
Setting range for positive and negative thresholds
(depending on measurement range) . . . . . . . . . . . . . . . . . 0.1 up to the
half measurement range
Jitter versus time
This function is used to record variations of jitter with time.
It allows the positive and negative peak values or peak-to-peak values
to be displayed versus time.
Measured values have one second resolution. Measurement duration is
up to 99 days.
By simultaneously evaluating alarms and errors, corellations between
events can be quickly identified.
Clock jitter measurement
The ANT-20SE can also measure the jitter on the clock signals
(square-wave) at standard bit rates. All built-in bit rates with electrical
interfaces up to 155 Mbit/s can be measured.
RMS measurement
T1.105.03, GR-253, GR-499, G.958 (or G.783 rev.)
The RMS value is measured on-line and displayed in UI.
The peak jitter and RMS values can be displayed simultaneously; a
graph versus time is available for long-term analysis. An RMS filter
preset is available.
15
Figure 7: Jitter peak-to-peak/RMS measurement.
Figure 8: Jitter versus time display.