3a analog picodlynx, Non-isolated dc-dc power modules, Preliminary data sheet – GE Industrial Solutions 3A Analog PicoDLynx User Manual
Page 9: Characteristic curves
GE
Preliminary Data Sheet
3A Analog PicoDLynx
TM
: Non-Isolated DC-DC Power Modules
3Vdc –14.4Vdc input; 0.6Vdc to 5.5Vdc output; 3A Output Current
December 7, 2012
©2012 General Electric Company. All rights reserved.
Page 9
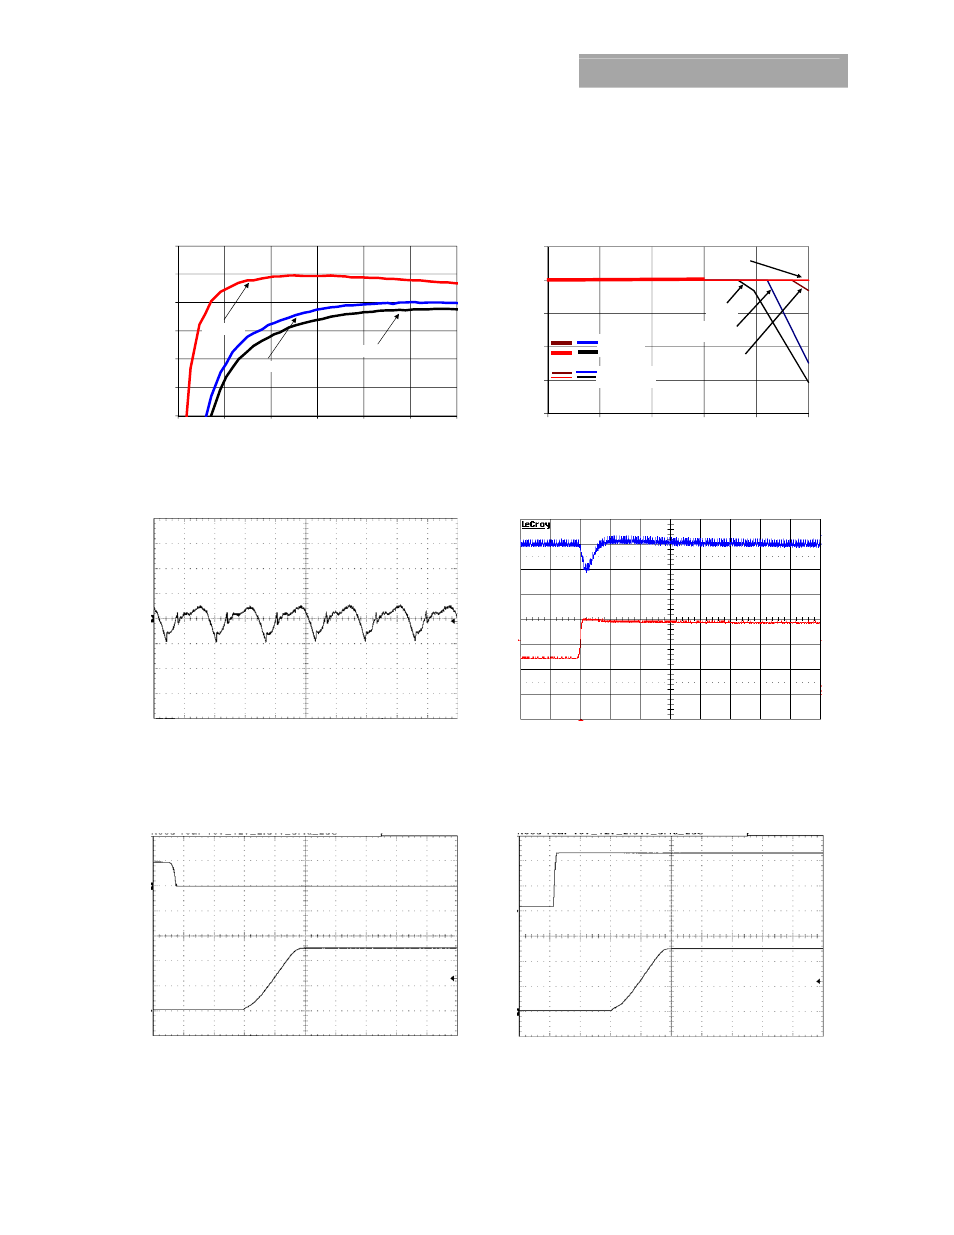
Characteristic Curves
The following figures provide typical characteristics for the 3A Analog PicoDLynx
TM
at 2.5Vo and 25
o
C.
EFFIC
IE
N
CY
, η
(
%
)
OUTPUT CURRENT
, Io (
A)
OUTPUT CURRENT, I
O
(A)
AMBIENT TEMPERATURE, T
A
O
C
Figure 19. Converter Efficiency versus Output Current.
Figure 20. Derating Output Current versus Ambient
Temperature and Airflow.
OUTPU
T V
O
LTAG
E
V
O
(V) (20mV
/div)
OUT
PU
T
CU
RR
EN
T,
OUT
PU
T V
O
LT
AG
E
I
O
(A
)
(1
Ad
iv
)
V
O
(V
) (5
0m
V/
di
v)
TIME, t (1
μs/div) TIME,
t
(20
μs /div)
Figure 21. Typical output ripple and noise (C
O
=10μF ceramic,
V
IN
= 12V, I
o
= I
o,max,
).
Figure 22. Transient Response to Dynamic Load Change
from 50% to 100% at 12Vin, Cout-2x47uF, CTune-2700pF &
RTune-261
OUT
PU
T V
O
LT
AG
E
O
N
/O
FF
V
O
LT
AG
E
V
O
(V
) (1V
/d
iv)
V
ON
/O
FF
(V
) (5
V/
di
v)
O
U
TP
UT
V
O
LT
AG
E
I
N
PU
T
VO
LT
AG
E
V
O
(V
) (1V
/d
iv)
V
IN
(V) (
5V/
di
v)
TIME, t (2ms/div)
TIME, t (2ms/div)
Figure 23. Typical Start-up Using On/Off Voltage (I
o
= I
o,max
).
Figure 24. Typical Start-up Using Input Voltage (V
IN
= 12V, I
o
= I
o,max
).
70
75
80
85
90
95
100
0
0.5
1
1.5
2
2.5
3
Vin=4.5V
Vin=14.4
V
Vin=12V
1.0
1.5
2.0
2.5
3.0
3.5
55
65
75
85
95
105
1.5m/s
(300LFM)
NC
Standard
Part (85
°C)
Ruggedized (D)
Part (105°C)
0.5m/s
(100LFM)
1m/s
(200LFM)