Characteristic curves, Continued) – GE Industrial Solutions Naos Raptor 20A User Manual
Page 9
Data Sheet
July 11, 2011
Naos Raptor 20A: Non Isolated Power Module:
4.5 – 14Vdc input; 0.59Vdc to 6Vdc Output; 20A output current
LINEAGE
POWER
9
Characteristic Curves
(continued)
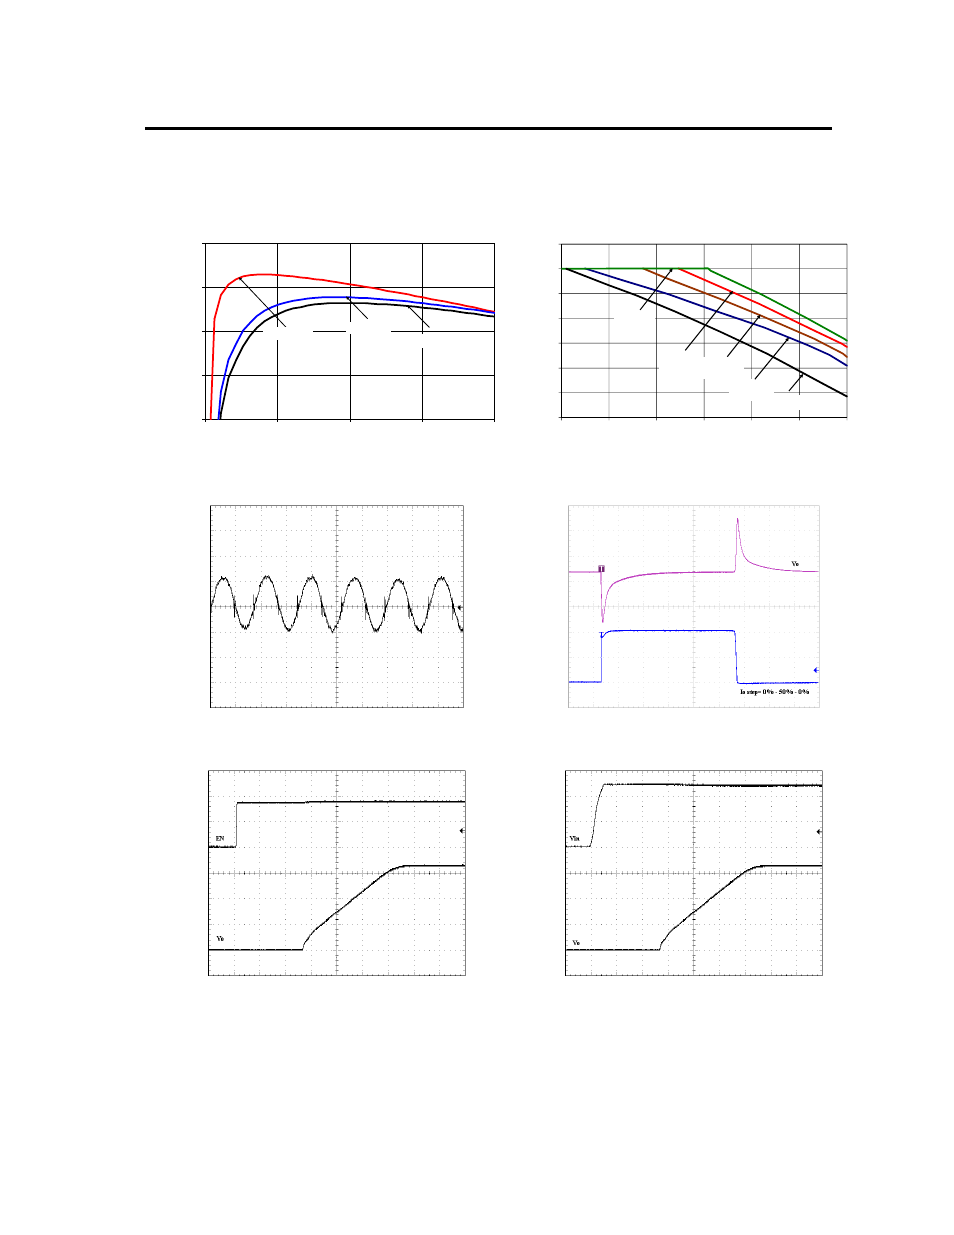
The following figures provide thermal derating curves for Naos Raptor 20A modules at 3.3Vout and 25ºC.
E
FFI
CIE
N
CY
, η
(%)
80
85
90
95
100
0
5
10
15
20
Vin = 4.5V
Vin = 12V
Vin = 14V
O
U
TPU
T
CUR
RE
NT,
Io
(
A
)
8
10
12
14
16
18
20
22
25
35
45
55
65
75
85
NC
0.5m/s
(100LFM)
1m/s
(200LFM)
1.5m/s
(300LFM)
2m/s
(400LFM)
OUTPUT CURRENT, I
O
(A)
AMBIENT TEMPERATURE, T
A
O
C
Figure 25. Converter Efficiency versus Output Current.
Figure 26. Derating Output Current versus Ambient
Temperature and Airflow.
O
U
T
P
UT
VO
LT
AG
E
V
O
(V
) (1
0m
V
/d
iv
)
OUT
P
UT
CU
RR
E
N
T
,
OUT
P
UT
VOL
T
A
G
E
I
O
(A
)
(5
Ad
iv
)
V
O
(V)
(200
mV
/d
iv
)
TIME, t (1
μs/div) TIME,
t
(100
μs /div)
Figure 27. Typical output ripple and noise (V
IN
= 12V, I
o
= I
o,max
).
Figure 28. Transient Response to Dynamic Load
Change from 0% to 50% to 0% with V
IN
=12V.
O
U
TP
U
T
VOLTAGE
ON
/OFF VOLTAG
E
V
O
(
V
)
(1V
/d
iv)
V
ON/
O
FF
(
V
)
(2
V
/d
iv
)
O
U
T
P
UT
VO
LT
A
G
E
IN
PUT
V
O
LT
A
G
E
V
O
(V
)
(1V
/di
v)
V
IN
(V
) (5
V
/di
v)
TIME, t (1ms/div)
TIME, t (1ms/div)
Figure 29. Typical Start-up Using On/Off Voltage (I
o
=
I
o,max
).
Figure 30. Typical Start-up Using Input Voltage (V
IN
=
12V, I
o
= I
o,max
).