Data sheet, Characteristic curves – GE Industrial Solutions QBDW025A0B Barracuda Series User Manual
Page 6
GE
Data Sheet
QBDW025A0B Barracuda Series; DC-DC Converter Power Modules
36-75Vdc Input; 12.0Vdc, 25.0A, 300W Output
May 9, 2013
©2012 General Electric Company. All rights reserved.
Page 6
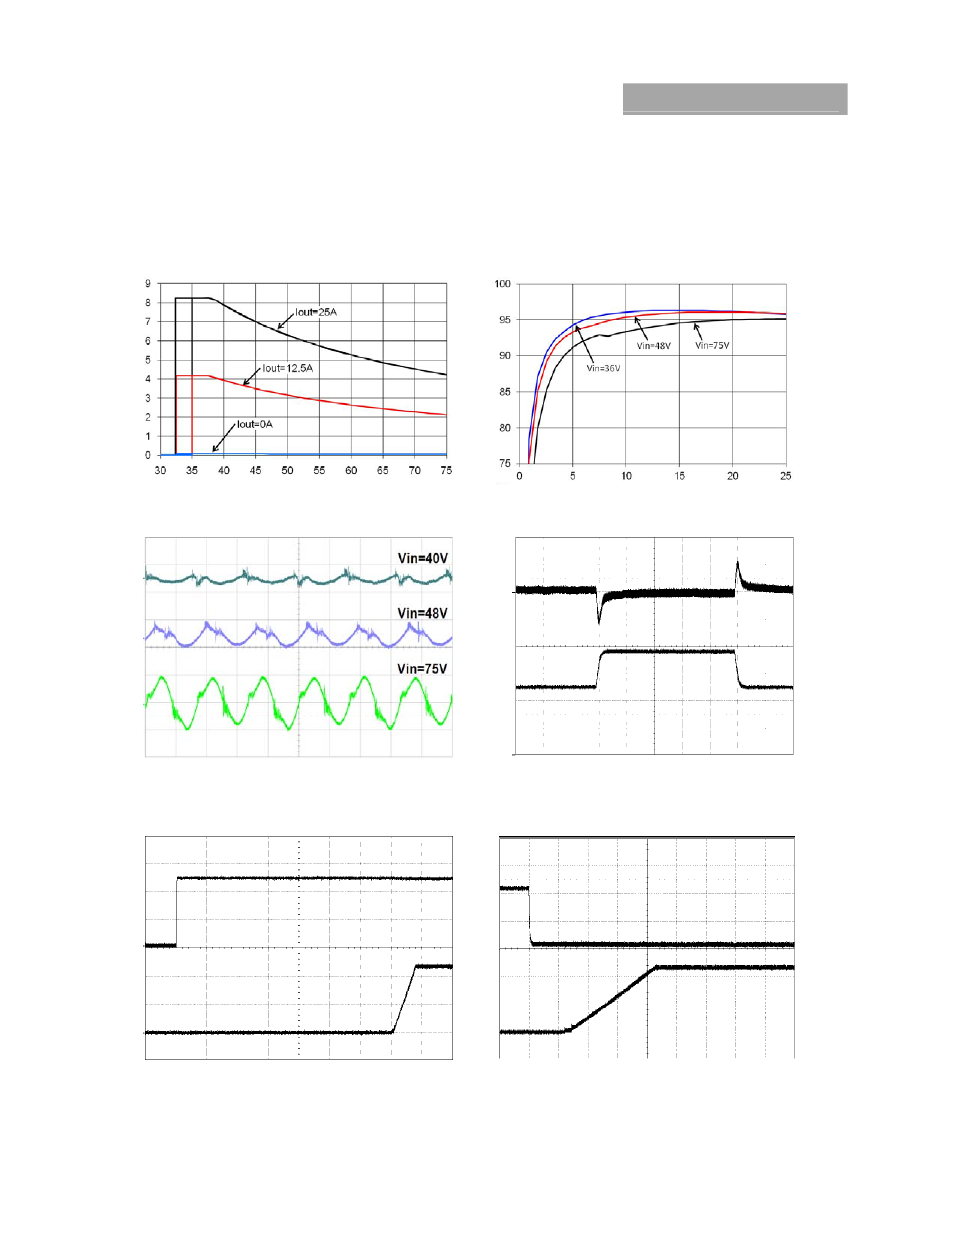
Characteristic Curves
The following figures provide typical characteristics for the QBDW025A0B (12V, 25A) at 25ºC. The figures are identical for either
positive or negative Remote On/Off logic.
I
N
PUT
CURREN
T, I
i
(A
)
EFFC
IENCY,
η
(%)
INPUT VOLTAGE, V
O
(V)
OUTPUT CURRENT, I
O
(A)
Figure 1. Typical Input Characteristic.
Figure 2. Typical Converter Efficiency vs. Output
Current.
OUT
PUT
VOL
TA
G
E,
V
O
(V
) (
50
m
V/
di
v)
O
U
TP
UT CURRENT OU
TPUT
VO
LT
AG
E
I
O
(A
) (1
0A
/d
iv
)
V
O
(V) (200
m
V/
di
v)
TIME, t (2s/div)
TIME, t (500 μs/div)
Figure 3. Typical Output Ripple and Noise, I
o
= I
o,max
.
Figure 4. Typical Transient Response to 0.1A/µs Step
Change in Load from 50% to 75% to 50% of Full Load,
Co=470µF and 48 Vdc Input.
OUTPUT VOLTA
G
E
INPUT V
O
LTA
G
E
V
O
(V
) (5
V/d
iv
)
V
IN
(V
) (2
0V
/d
iv
)
OUTPUT
VOLTA
G
E
On/Off VO
LT
AGE
V
O
(V) (5V/
di
v)
V
ON
/O
FF
(V
)(2
V/d
iv
)
TIME, t (20 ms/div)
TIME, t (5 ms/div)
Figure 5. Typical Start-Up Using Vin with Remote On/Off
enabled, negative logic version shown.
Figure 6. Typical Start-Up Using Remote On/Off with Vin
applied, negative logic version shown.