Characteristic curves – GE Industrial Solutions FNW500R Series User Manual
Page 5
Data Sheet
October 5, 2009
FNW500R Power Modules; DC-DC Converters
36 – 75 Vdc Input; 28Vdc Output; 500W Output
5
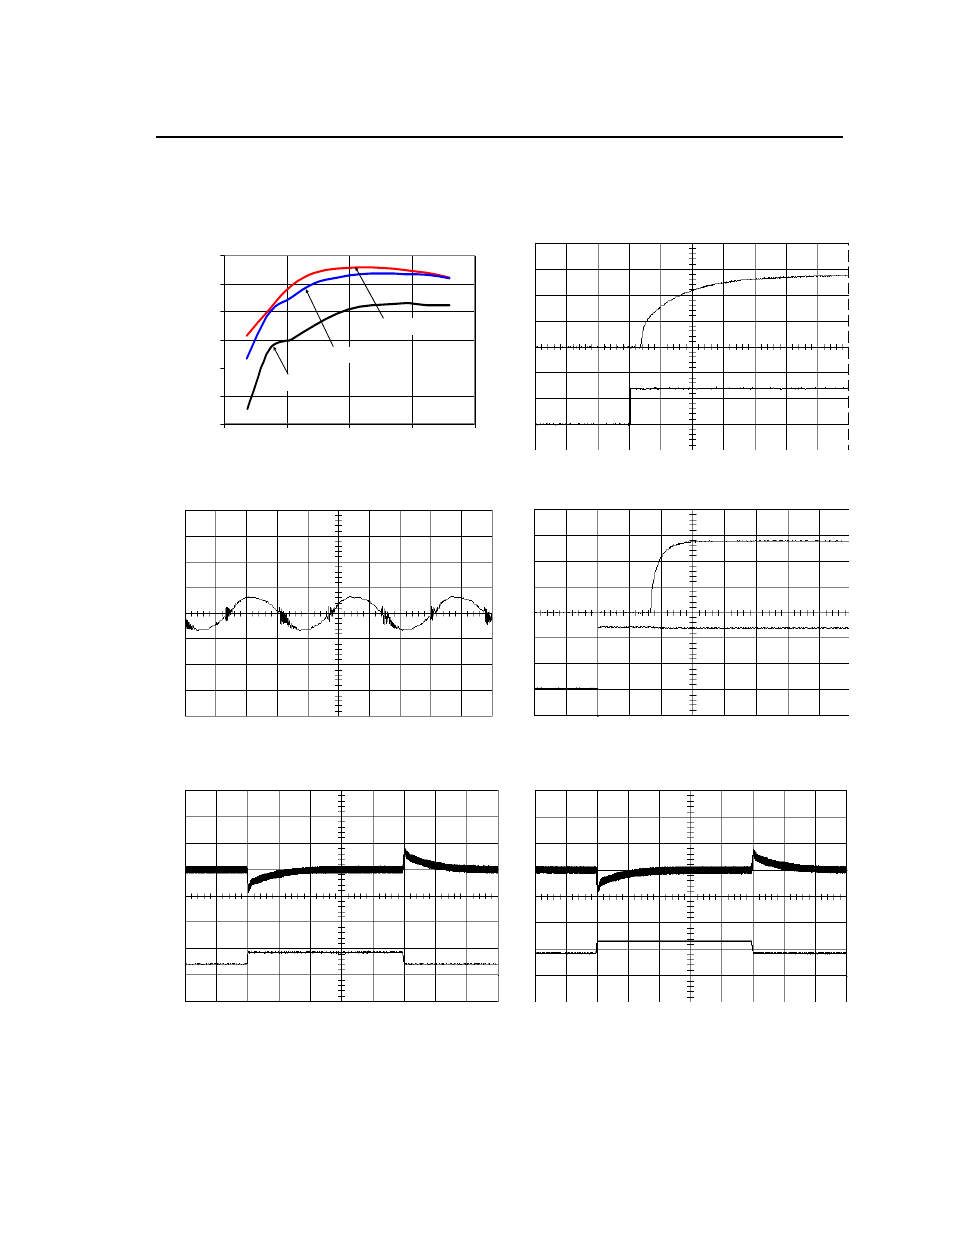
Characteristic Curves
The following figures provide typical characteristics for the FNW500R (28V, 18A) at 25ºC. The figures are identical for
either positive or negative Remote On/Off logic.
81.0
83.0
85.0
87.0
89.0
91.0
93.0
0
5
10
15
20
Vin=36V
Vin=48V
Vin=75V
E
F
F
IC
IE
NCY
(%)
OUTPUT CURRENT, I
o
(A)
On
/O
ff V
O
LT
A
G
E
O
U
T
P
UT
VO
LT
AG
E
V
ON/
O
FF
(V
)
(2
V/
div)
V
O
(
V
) (1
0V
/d
iv
)
TIME, t (10ms/div)
Figure 1. Converter Efficiency versus Output
Current.
Figure 4. Typical Start-Up Using Remote On/Off,
R1=30Kohm; C
o,ext
= 470µF.
O
U
TP
U
T
VOLTAGE,
V
O
(
V
) (
100
m
V
/d
iv
)
TIME, t (1
μs/div)
IN
PU
T
VO
LTAGE
O
U
TP
U
T
V
O
L
T
A
G
E
Vi
n
(V
) (2
0V
/d
iv
)
V
O
(V
) (1
0V
/d
iv
)
TIME, t (50ms/div)
Figure 2. Typical Output Ripple and Noise at Room
Temperature and 48Vin; I
o
= I
o,max
; C
o,ext
= 470µF.
Figure 5. Typical Start-Up Using from V
IN
, positive
logic version shown; C
o,ext
= 470µF.
VO
LTAG
E
I
O
(A
) (1
0A
/di
v)
V
O
(V
) (5
00
mV
/d
iv
)
TIME, t (1ms/div)
OU
T
P
UT
C
U
R
R
E
NT
O
U
T
P
UT
V
O
LT
A
G
E
I
O
(
A
) (
5A/d
iv)
V
O
(V
) (5
00
mV
/d
iv
)
TIME, t (1ms/div)
Figure 3. Transient Response to Dynamic Load
Change from 25% to 50% to 25% of Full Load at
Room Temperature and 48 Vdc Input; 0.1A/uS
Figure 6. Transient Response to Dynamic Load
Change from 50% to 75% to 50% of Full Load at
Room Temperature and 48 Vdc Input; 0.1A/uS