2 frequency response curves – Guralp Systems CMG-3ESPCD User Manual
Page 29

CMG-3ESPCD Digital Broadband Seismometer
Calibrating the 3ESPCD
mechanics and electronics can be disregarded. This relationship, given in
terms of the Laplace variable s, takes the form
( V / x ) (s) = G × A × H (s)
In this equation
•
G is the acceleration output sensitivity (gain constant) of the
instrument. This relates the actual output to the desired input over the
flat portion of the frequency response.
•
A is a constant which is evaluated so that A × H (s) is dimensionless
and has a value of 1 over the flat portion of the frequency response. In
practice, it is possible to design a system transfer function with a very
wide-range flat frequency response.
The normalising constant A is calculated at a normalising frequency
value fm = 1 Hz, with s = j fm, where j = √–1.
•
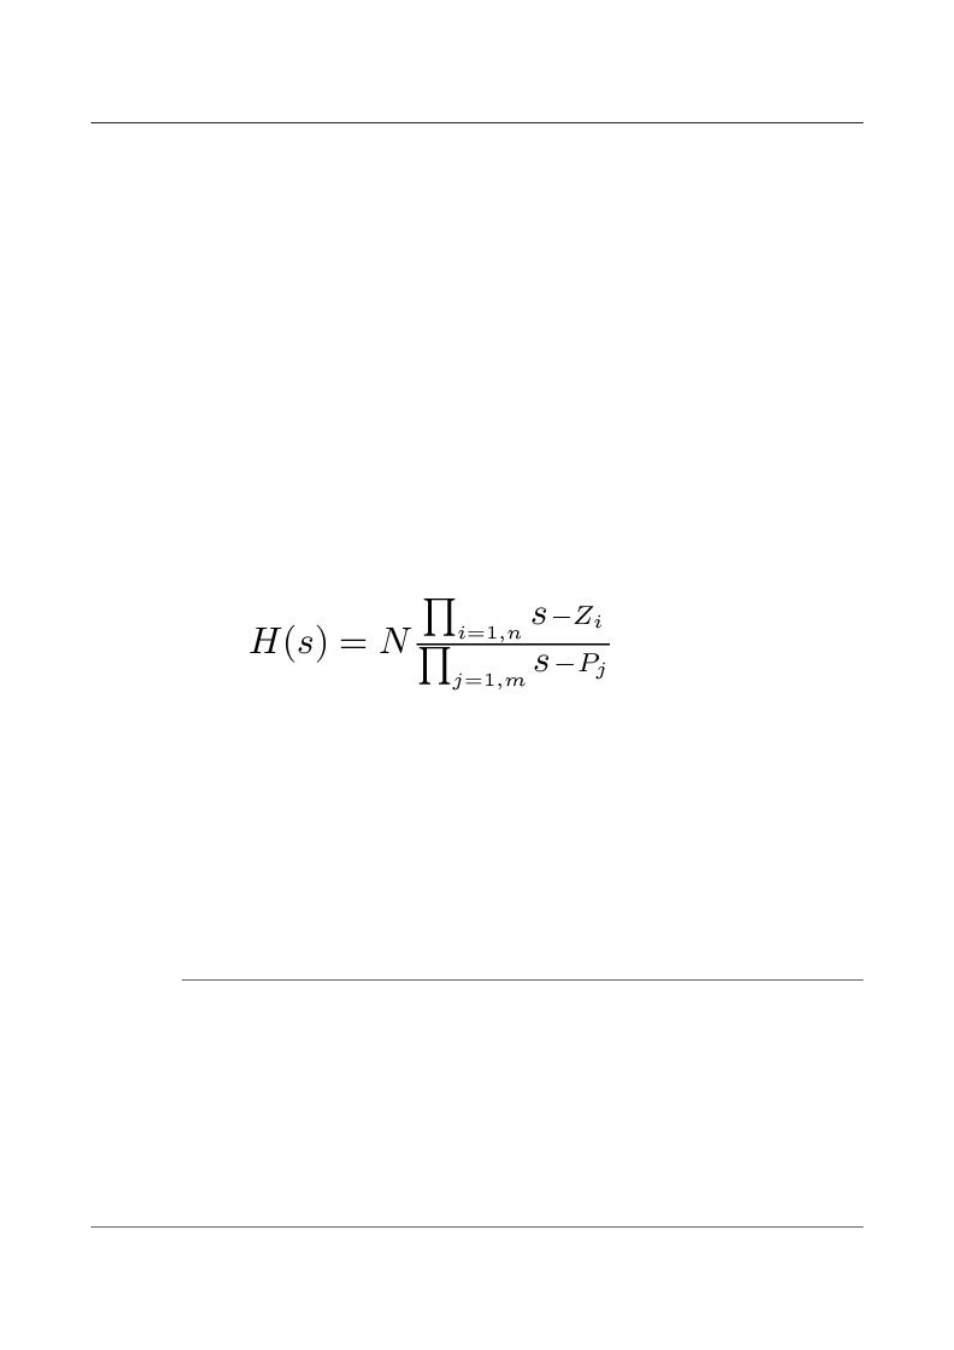
H (s) is the transfer function of the sensor, which can be expressed in
factored form:
In this equation, z
n
are the roots of the numerator polynomial, giving
the zeros of the transfer function, and p
m
are the roots of the
denominator polynomial giving the poles of the transfer function.
In the calibration pack, G is the sensitivity given for each component on the
first page, whilst the roots z
n
and p
m
, together with the normalising factor A,
are given in the Poles and Zeros table. The poles and zeros given are
measured directly at Güralp Systems' factory using a spectrum analyser.
Transfer functions for the vertical and horizontal sensors may be provided
separately.
4.1.2 Frequency response curves
The frequency response of each component of the 3ESPCD is described in the
normalised amplitude and phase plots provided. The response is measured at
low and high frequencies in two separate experiments. Each plot marks the
low-frequency and high-frequency cutoff values (also known as –3 dB or
half-power points).
29
Issue B - November 2013
