Fluke Biomedical IDA-5 User Manual
Page 26
IDA-5
Users Manual
16
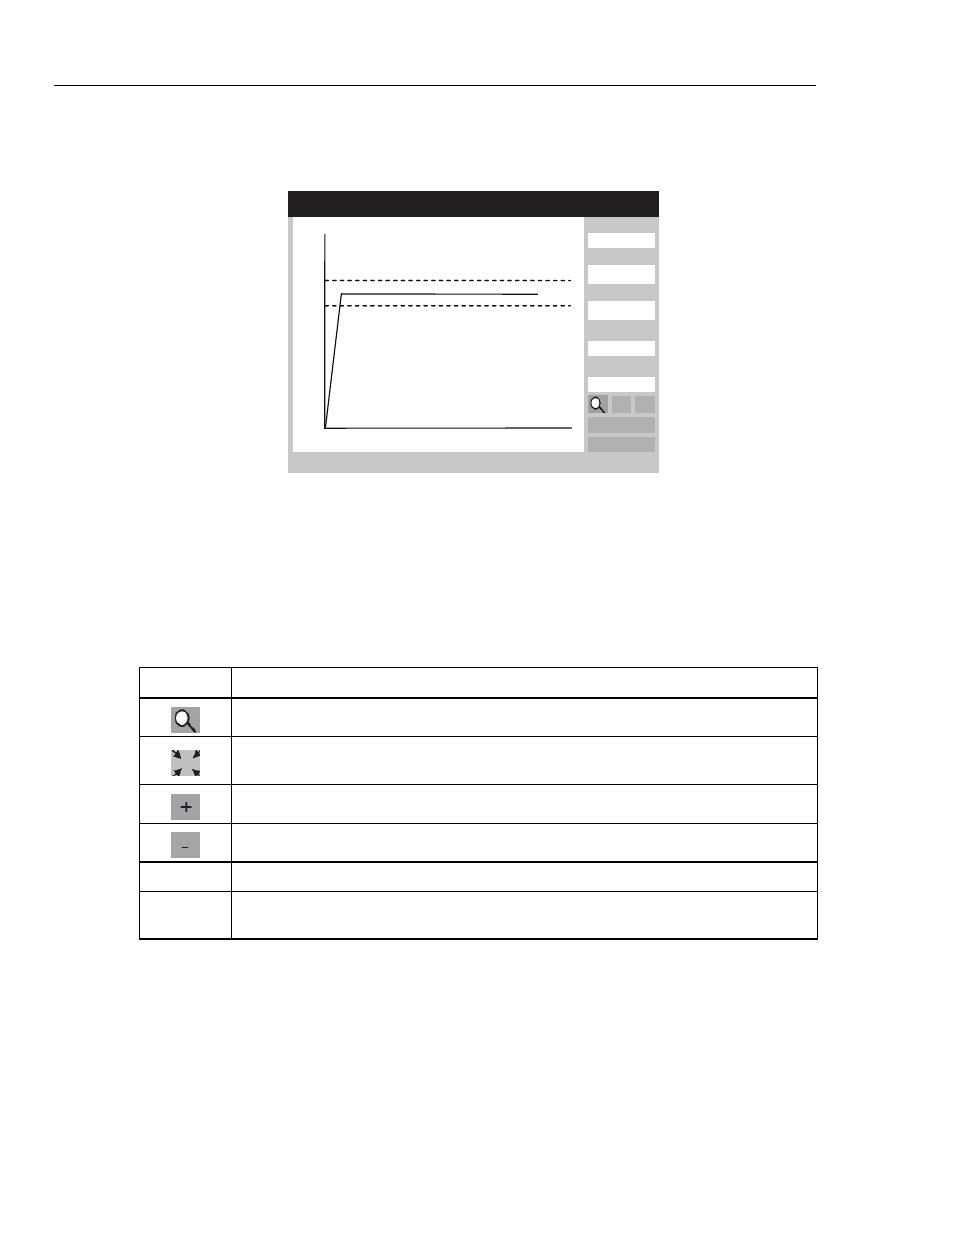
Select Graph on the menu and then push ENTER to show a graph of the test
progress as shown in Figure 6 prime mode. Push End and then ENTER to
complete the test and go to the Flow screen (End Mode).
C h a n n e l 1 F l o w G r a p h ( A v e )
Average
59.70
Deviation
-0.50%
Inst
60.20
Total Volume
19.60
Elapsed Time
00:20:00
+
-
View Detail
80
Ml/h
0
0 Min 30
Ave/Inst
Press ESC for Status Screen
gir11.eps
Figure 6. Channel Flow Graph
In addition to the graph, the same parameters in the flow screen are shown along
the right side of the graph screen. An additional parameter shows the deviation
percentage from the set flow rate.
Table 10 shows the controls in the lower-left corner of the Channel Flow Graph
screen and describes their purpose.
Table 10. Flow Graph Screen Controls
Control Description
Shows the default zoom level.
Shows the default zoom view. This icon replaces the magnifying glass when the graph is
zoomed.
Zoom in (expand) the Y-axis.
Zoom out (contract) the Y-axis.
View Detail Go to the Channel Flow screen (see Table 11).
Ave/Inst
Changes the graph that is shown. Each push cycles through the views of Average,
Instantaneous, and Average and Instantaneous.
When the test is completed, the menu at the bottom of the screen changes to the
menu shown in Table 11.