Chart display options – Xtramus NuApps-SwitchPerform V1.8 User Manual
Page 36
36
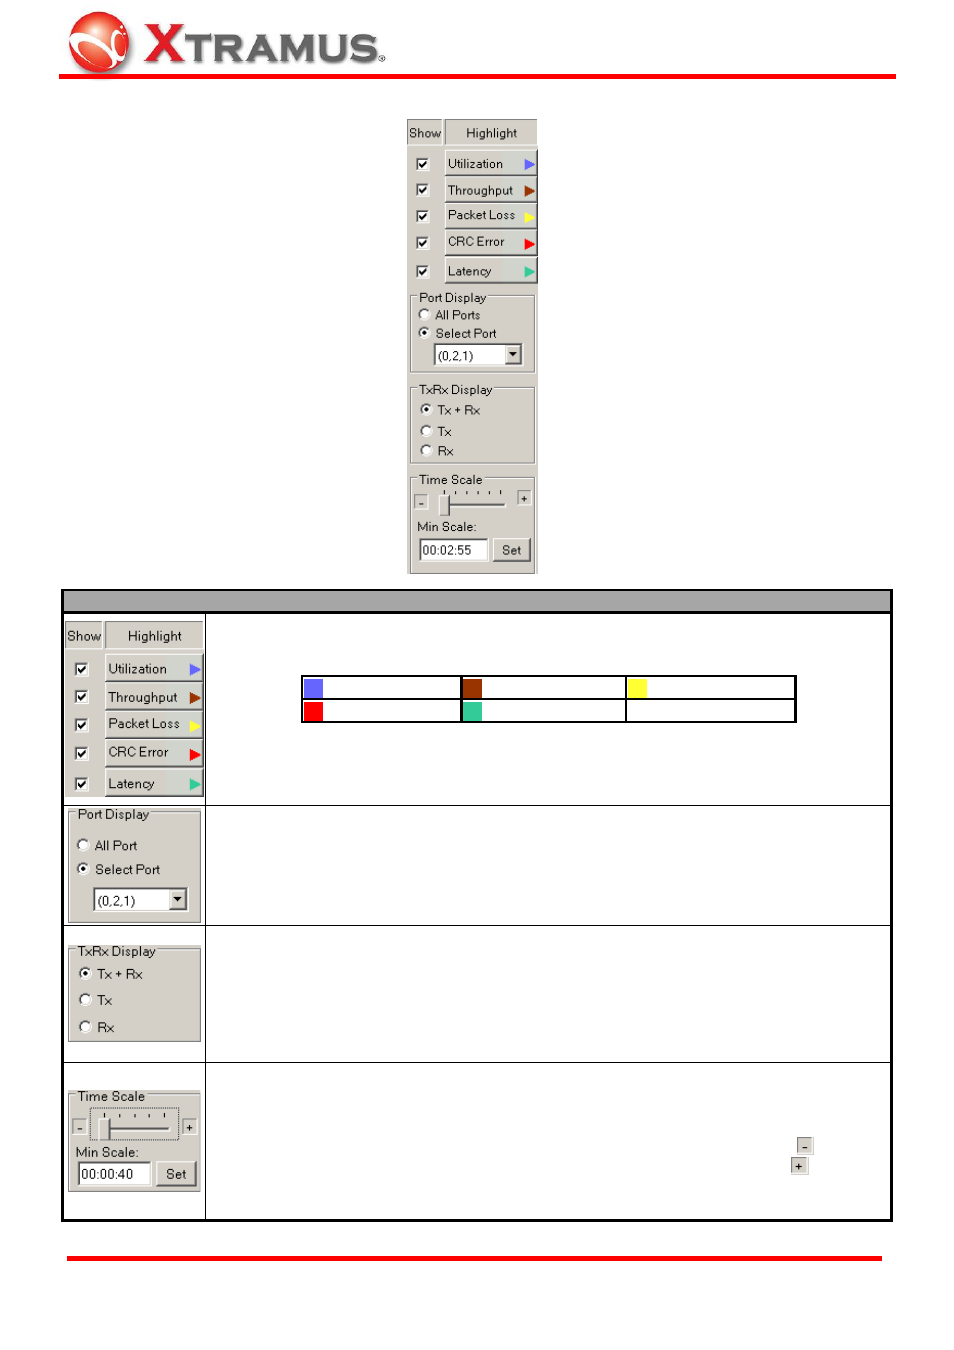
4.7.3. Chart Display Options
Chart Display Options Descriptions
These buttons can show/hide the lines that represent different statistics base on their
categories:
Utilization
Throughput
Packet Loss
CRC Error
Latency
These check-boxes allow you to show/hide the lines that represent each different
statistics. Also, clicking these buttons allows you to highlight the statistics displayed on
the Main Display Screen.
The Port Display can show/hide the lines that represent different statistics base on
ports.
¾ All Port: Display all statistics as chart in the Main Display Screen of all ports.
¾ Select Port: Click the scroll-down menu to choose the port and display its
statistics as chart in the Main Display Screen.
The TxRx Display can show/hide the lines that represent different statistics base on
Transmitting/Receiving.
¾ Tx + Rx: Display all Transmitted/Received Packets statistics as chart in the
Main Display Screen.
¾ Tx: Display all Transmitted Packets statistics as chart.
¾ Rx: Display all Received Packets statistics as chart.
The Time Scale and Min Scale allow you to adjust the X-Axis scale of the chart
displayed in the Main Display Screen.
¾ Time Scale: The Time Scale allows you to adjust the chart displaying scale. To
view the chart in a short period of time, move the cursor towards the
icon. To
view the chart in a long period of time, move the cursor towards the
icon.
¾ Min Scale: You can set the starting value of the X-Axis here. Press the Set button
to apply the changes you made in Min Scale.
E-mail: [email protected]
Website: www.Xtramus.com
XTRAMUS TECHNOLOGIES
®