Chart – Xtramus NuApps-SwitchPerform V1.8 User Manual
Page 33
33
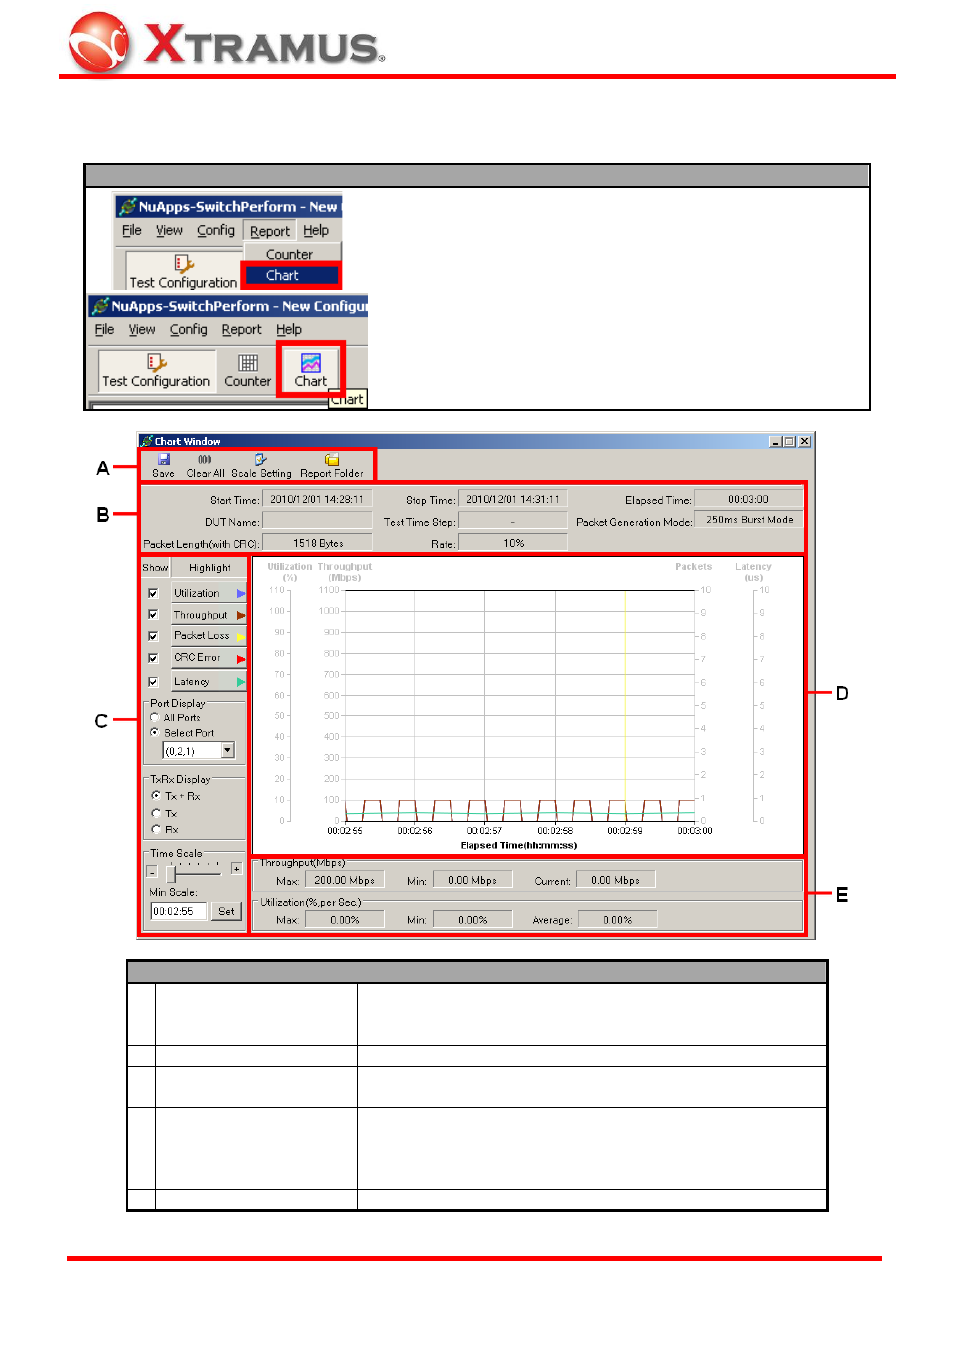
4.7. Chart
You can view test result charts here. There are two ways to access Chart:
Accessing Chart
•
Click Chart located on Report in the Menu Bar.
•
Click the Chart button located on Quick Launch Buttons.
Accessing Counter Report
A Control
Buttons
These two buttons allow you to save the counter report,
clear all statistics, make chart display settings, and open the
folder where Chart files are saved.
B Test
Information Test information is displayed in this field.
C Chart Display Options
The Chart Display Options allows you to adjust the chart
displayed in the Main Display Screen.
D
Main Display Screen
The Main Display Screen that displays the test chart. The
Elapsed Time is represented in X-Axis, while the
Utilization (%), Throughput (Mbps), Packets, and
Latency (microsecond, µs) are represented in Y-Axis.
E Throughput/Utilization These fields display the throughput/utilization information.
E-mail: [email protected]
Website: www.Xtramus.com
XTRAMUS TECHNOLOGIES
®