Channel visibility controls, Waveform display mode control – Dataman 520 Series User Manual
Page 32
DATAMAN 520 series oscilloscope with rollmode
User’s Guide
The result of a time period measurement with time discontinuity caused by internal
buffer overflow is displayed in red color, or as a string followed by “!” character. This
indicates, that the displayed time is not correct.
If the time break is caused by ARM-ing the data acquisition, the time can be
reconstructed and there is no difference between displaying the result of
measurements with no time discontinuities and with time discontinuities caused by
ARM-ing.
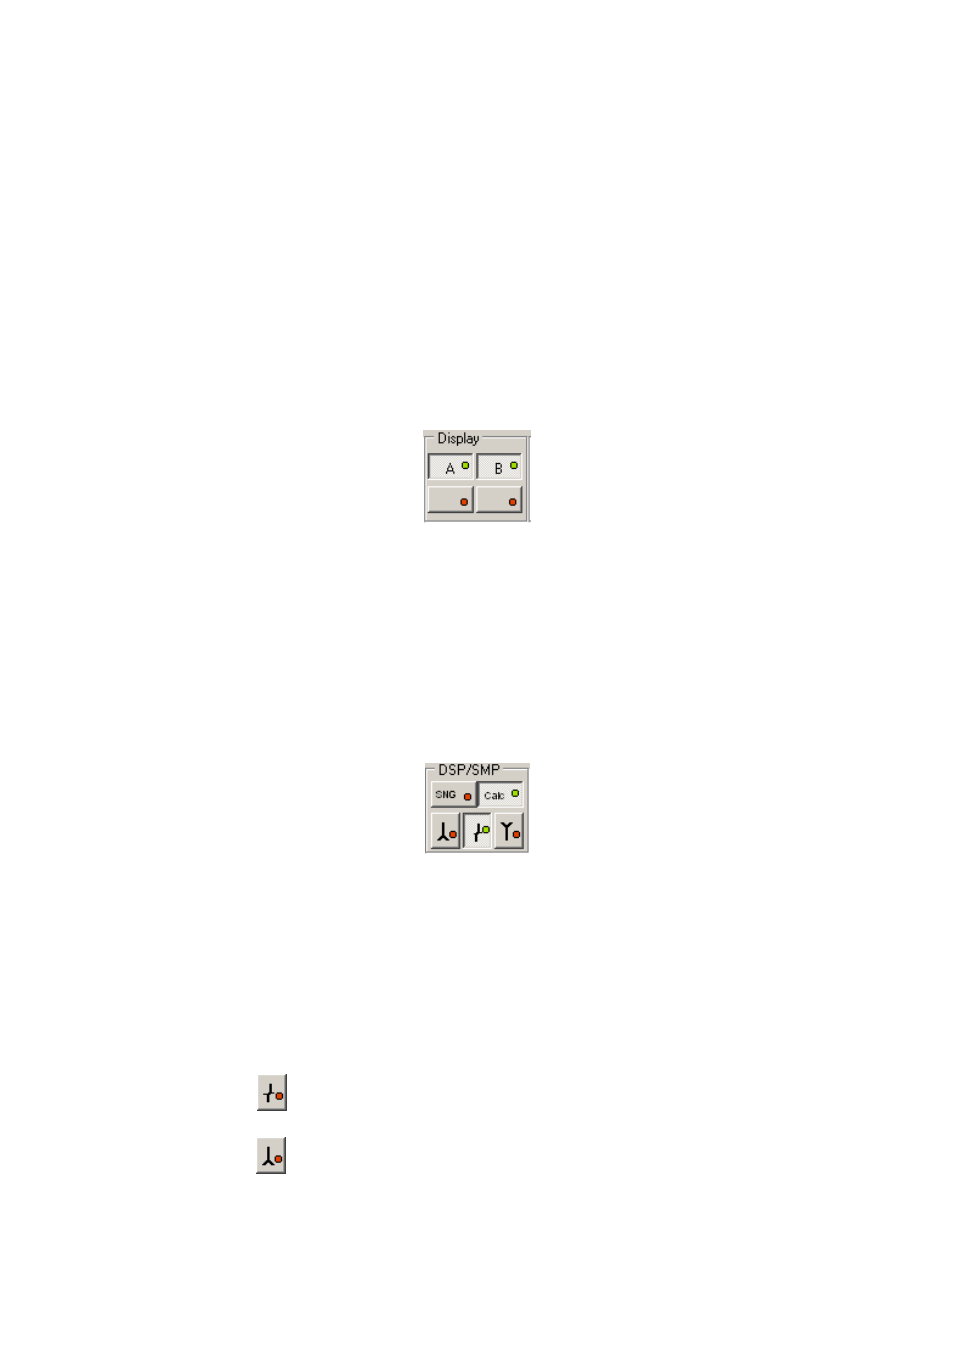
5.4. Channel visibility controls
The channel visibility controls are located in the left of the main window.
Fig. 5.4.1. – Channel visibility controls
“A“ – activates/deactivates channel A waveform
“B“ – activates/deactivates channel B waveform
The buttons on the bottom row are reserved for future use and have no effect.
5.5. Waveform display mode control
The controls are located in the bottom of the main window.
Fig. 5.5.1. – Waveform display mode controls
If more than 1 sample is displayed to one dot of the waveform, it is necessary to set
the mode of creating the dot. There are two buttons to choose the basic mode.
If “SNG” is selected, only the first sample of time period represented by the
dot is displayed.
If “Calc” is selected, the dot is calculated out of all samples. The method of
calculation depends on the following controls:
If
the
is activated, the displayed dot is calculated as average of the
measured samples.
If
the
is activated, the displayed dot is calculated as a maximum of
measured samples.
- 32 -