Grid controls – Dataman 520 Series User Manual
Page 13
DATAMAN 520 series oscilloscope with rollmode
User’s Guide
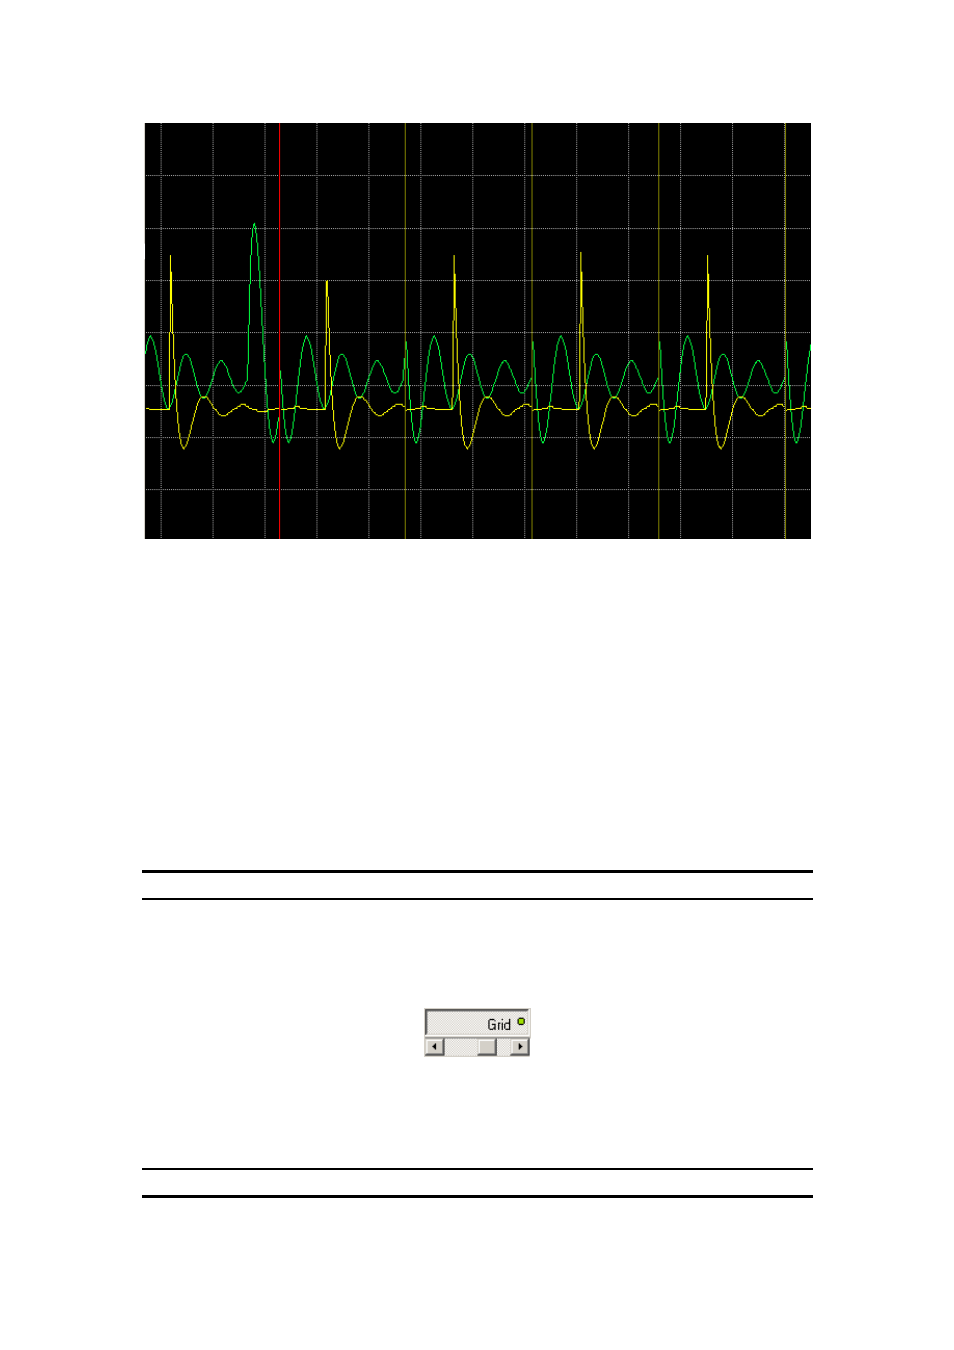
Fig. 4.1.1. – Oscilloscope screen
The oscilloscope screen is divided into 8 vertical divisions. The number of horizontal
divisions depends on the size of the application window and the screen resolution.
There are three kinds of indicators displayed on the screen.
- If the buffer overflow occurs and some data is lost the data loss is marked by a red
vertical line. This line marks the lose of data continuity.
- The device settings change is marked by a red vertical line.
- If the data acquisition is blocked by ARM conditions, the data discontinuity is
marked by an olive green vertical line.
The waveforms are displayed in the colors selected for each channel. The default
colors are: green for channel A and yellow for channel B.
TIP: The channel colors can be changed in main menu.
4.2. Grid controls
The cursors and grid controls are located in the left part of the main window.
Fig. 4.2.1. – Grid controls
“Grid” – switches the grid on/off
The scrollbar – adjusts grid brightness
TIP: The grid color can be changed in the main menu.
- 13 -