Visualization of data recorded, Quality events – CIRCUTOR CIReQ User Manual
Page 23
_______________________________________________________
_________________________________________________________________________________________________________
CIR-eQ User’s Manual
23 of 36
6.6.- VISUALIZATION OF DATA RECORDED
CIR-eQ records two different file types. One is a STD file which includes standard
electrical parameters. The other is EVQ file that includes quality events recorded by the
analyzer. Is recommended for study the data recorded using the software Power Vision
or Power Vision +, that allow visualization of the two types of files and display data using
graphs and / or tables.
However, it is possible to send data standard (STD file) of the web of CIR-e3. To register
as a user of the Web, send and display STD data, see Chapter 8. CIR-e3 Web.
7.- QUALITY EVENTS
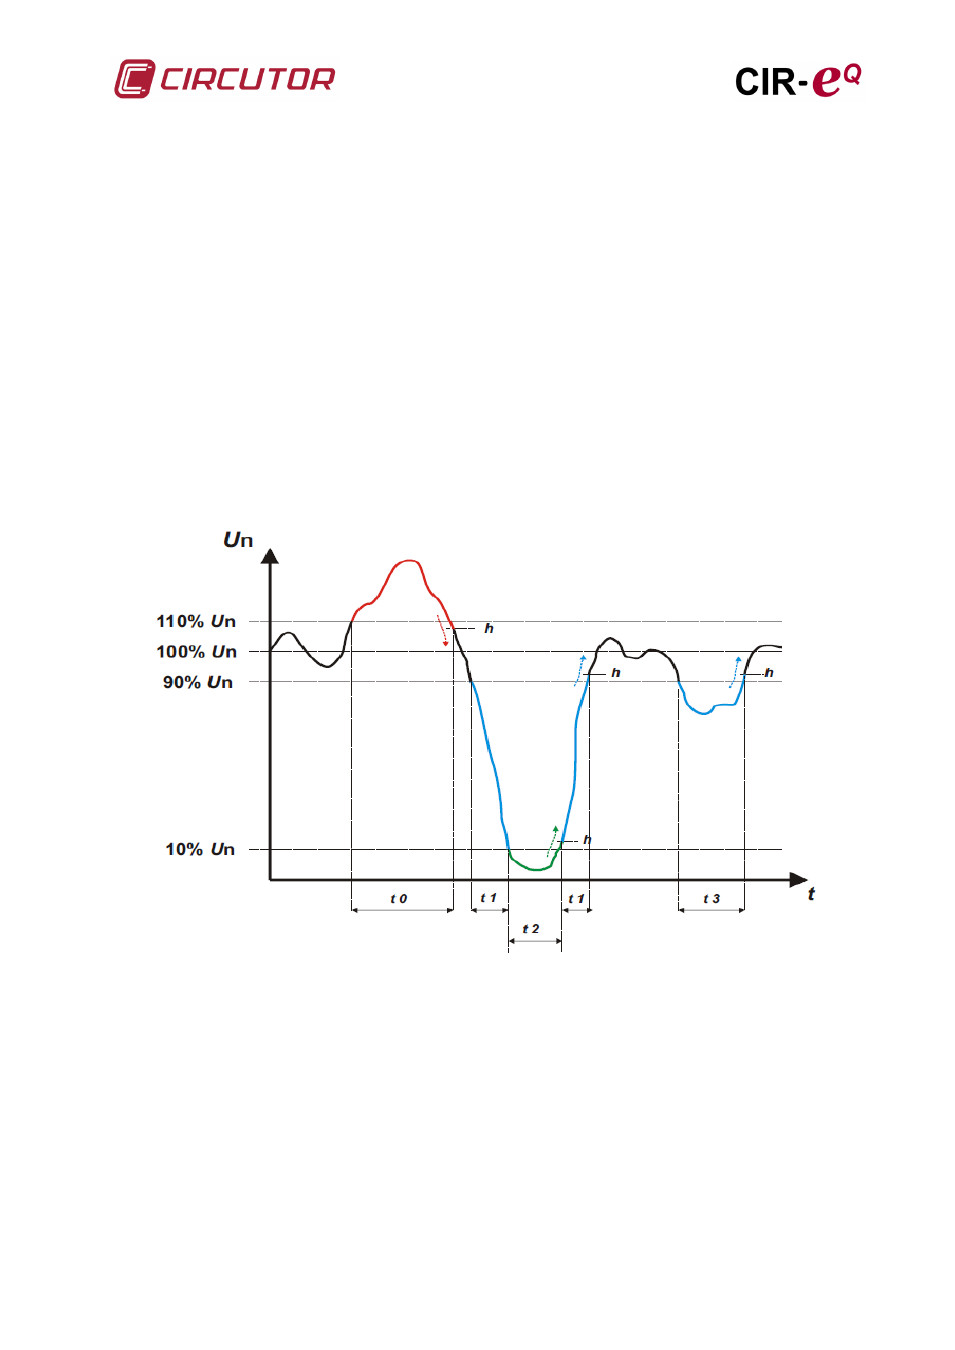
By way of example shows a graph of the possible evolution of a voltage signal observed
in the three event types that are registered with CIR-eQ.
The graph shows a quality event for voltage bounded in the t0 interval time. The duration
of the event of over voltage is equal to the time the signal is above the value set to detect
over-voltages (equal to 110% of Vnom) plus the time it takes the signal to fall below the
hysteresis value (About V His ) normally scheduled at 2%. Other events visible in the
graph are bounded in t1 and t3. These events correspond with some gaps. The overall
gap is set at 90% of Vnom so register until fall below 10% (in this case is recorded as
interruption, represented in the graph in the interval t2 or recovers back above 90%
configured, plus 2% hysteresis (Sag Hys).
Quality events recording the CIR-eQ must have a minimum duration of 10ms. If the event
does not last the minimum time is not recorded as such, even if it affects the average
value calculated for that period.