Link statistics tab, Power and temperature tab – Altera Transceiver Signal Integrity User Manual
Page 21
Chapter 6: Stratix IV GT Transceiver Signal Integrity Demonstration
6–5
Running the Demonstration Application and Test Designs
December 2014
Altera Corporation
Transceiver Signal Integrity Development Kit,
Stratix IV GT Edition User Guide
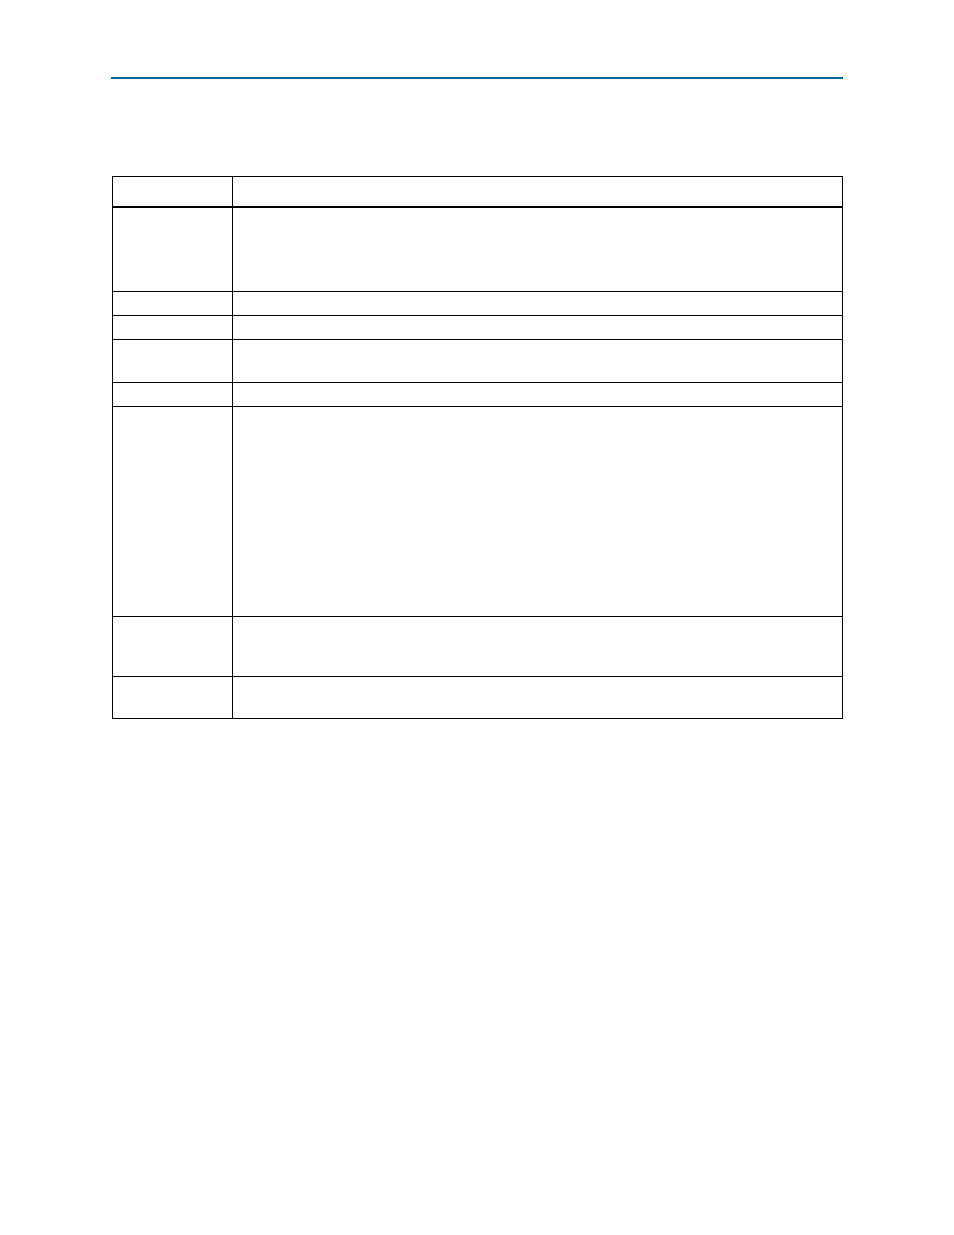
Link Statistics Tab
The Link Statistics settings include the following options:
Power and Temperature Tab
The application displays the Stratix IV device junction temperature. It also shows the
power or current values for the six supply rails.
You can also observe the power and temperature values on the LCD. For more
information, refer to
Parameter
Description
Statistics
Displays the BER, number of bits received, number of errors received, and the error slope based on the
selection from the list.
The error slope shows the error trend (increase or decrease). You can use this statistic to determine
whether the PMA control settings must be increased or decreased to get an error free link.
Inject Error
Injects errors in the channels. Every time this button is asserted, one-bit error is introduced.
Data Patrst
Reset for the data pattern generators and checkers.
Data Rate
Based on the test design selected, the application displays the serial data rate of the transceiver
channels.
GXB Encoding
Displays whether the data sent by the test design is 8B/10B encoded.
DataChk Status
The DataChk Status field displays the following:
n synced status displayed in green indicates that the error checker has received the predefined header
byte and no errors are detected.
n unsynced status displayed in gray indicates that the error checker has not received the selected
pattern.
n If the DataChk Status field shows unsynced, check whether the transmitter of the channel
showing unsynced is connected to the receiver channel by external cable or by internal serial
loopback. However, when sending the high frequency data pattern, the DataChk Status shows
unsynced. This is because the error checker is not provided for high frequency pattern.
n error status indicates that the error checker is detecting errors in the received pattern.
CDRLock Mode
Shows whether the transceiver Clock Recovery Unit (CRU) is locked to the reference clock or to the
data. When the transceiver locks to the incoming data, this field displays data indicating that the
receive PLL has recovered the clock from the incoming data.
Freeze Display
When you click the Freeze display button, the display field does not change and the counting
continues. When you click the Unfreeze display, the current running values are shown.