User manual – SurgeX Defender Series Surge + Diagnostic User Manual
Page 22
User Manual
© 2013 SurgeX / Electronic Systems Protection, Inc. /
Technical Support 800.645.9721 /
www.surgex.com /
21
3. All events recorded while a computer is connected to the Surge + Diagnostic
will have
an accurate date and time stamp, since the computer will supply power to the Surge +
Diagnostic microcontroller in the event of a power outage (as long as the computer
stays on).
4. The graph uses the values of 0%, 50%, 150%, and 600% for graphical display of
power outages, under-voltages, over-voltages, and surge events, respectively; the
actual voltages during these events are not recorded and probably differ from the
graphical values (0%, 50%, 150%, and 600%) shown.
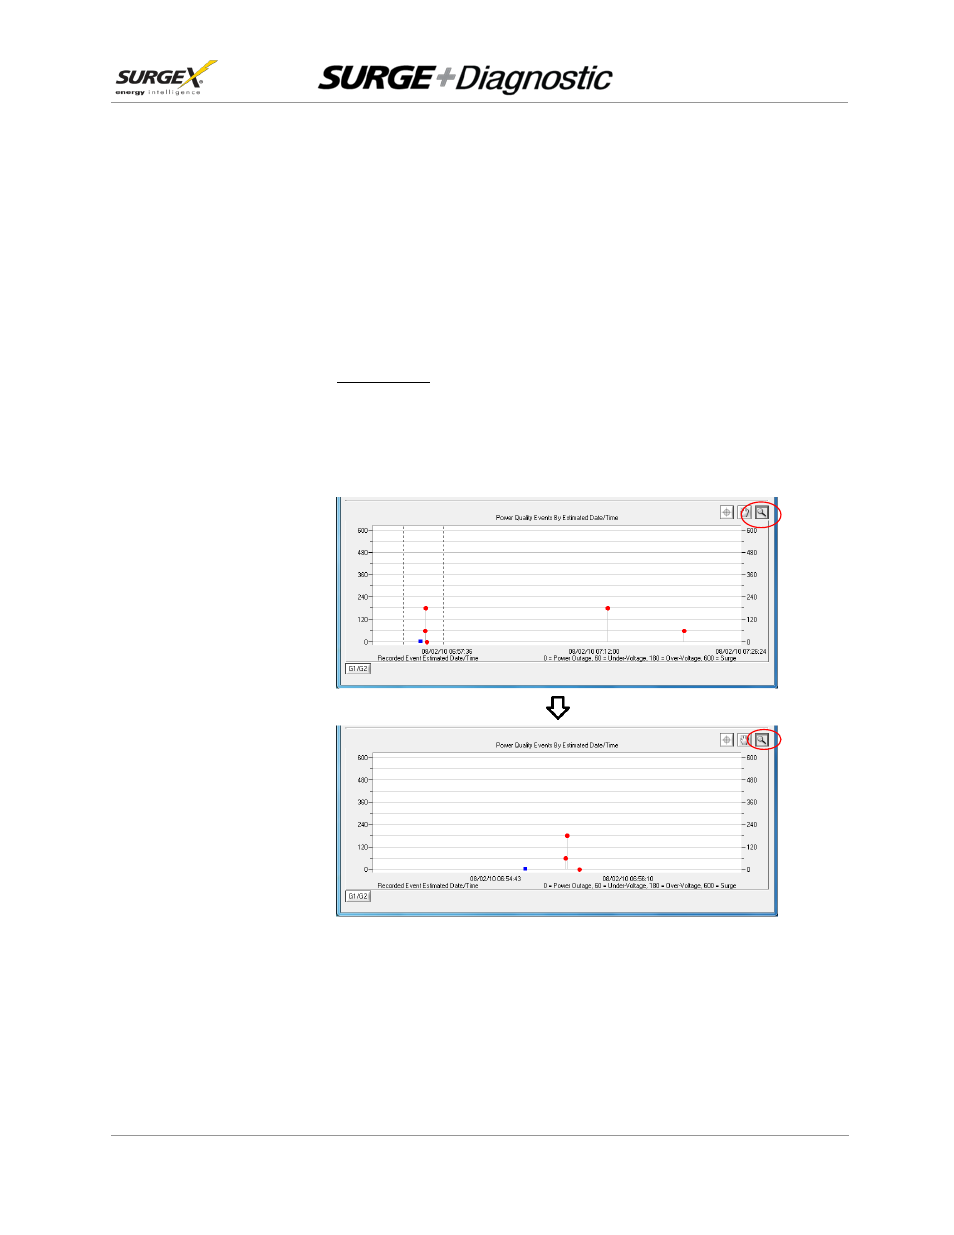
5.
Zoom Function: The recorded power quality events graph may be zoomed along the
X (time) axis. To zoom in on an area of the graph, press the magnifying glass icon,
press and hold the left mouse button somewhere on the graph, then drag the cursor
either left or right to define the zoom selection, and then release the left mouse button.
The graph will now display the selected area. Press the magnifying glass icon again
to restore the original full display.