Echelon Rapid Deployment Example for EES User Manual
Page 31
Rapid Deployment Example for EES
21
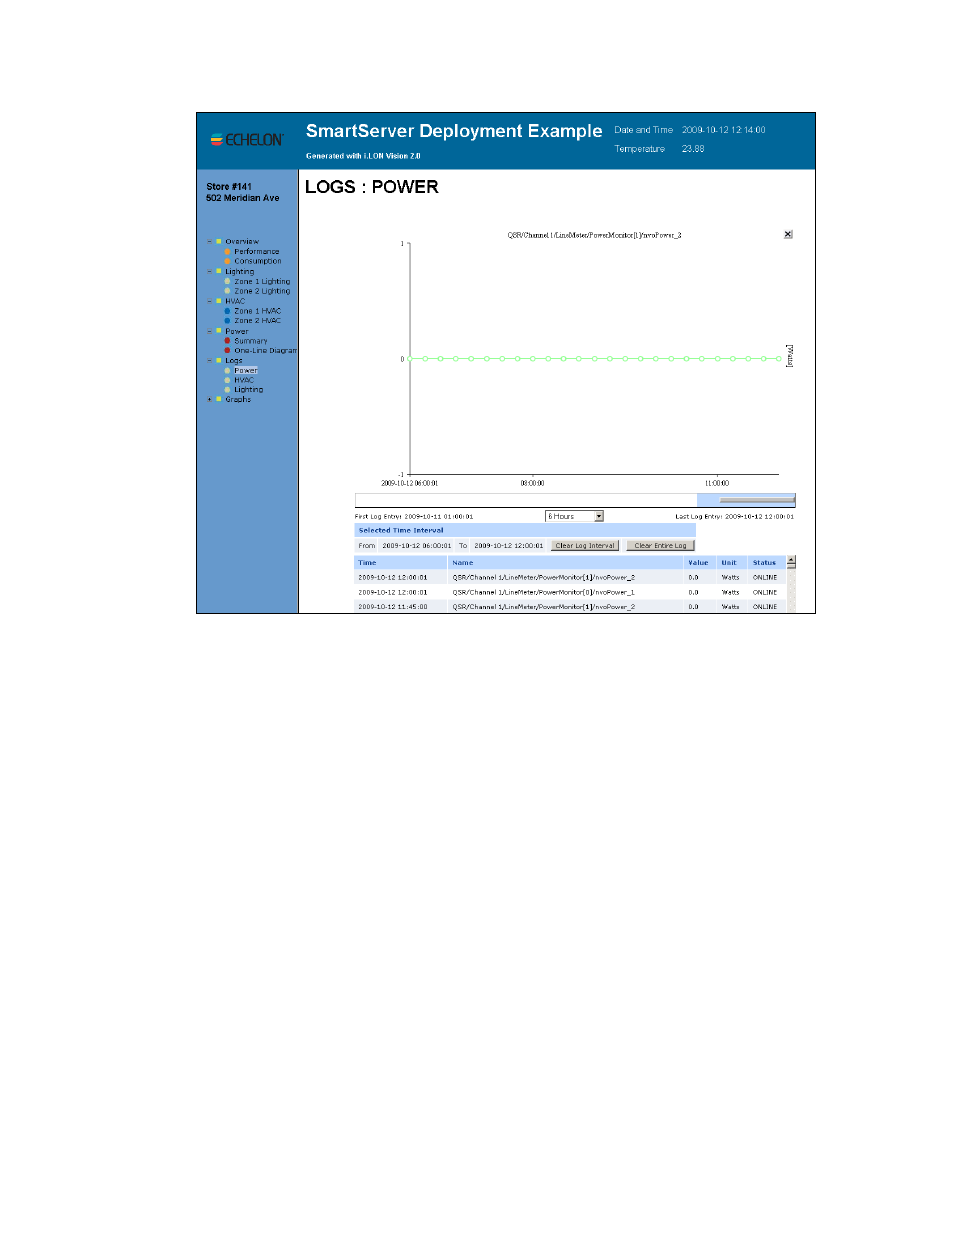
3. This Web page displays a trend graph and a log that chart and list the energy consumption (in
watts), temperature, or lighting state for the selected zone over a specific interval. Note that the
trend graph only appears if Adobe SVG Viewer 3.03 is installed on your computer. If Adobe
SVG Viewer is not installed on your computer, a Show Graph link appears where the graph
normally would. You can install Adobe SVG Viewer 3.03 from the i.LON SmartServer 2.0 DVD.
4. You can move the mouse pointer over one of the plotted data point updates to show a ToolTip.
The ToolTip lists the date and time of the update and the value and state of the data point at the
time the update was recorded.
5. The table lists the first to last recorded data point updates in descending chronological order. You
can sort the data point updates by clicking a property header. This Web page displays the
following properties for each recorded data point update:
Selected Time
Interval
Displays the user-specified interval, which determines the data points
currently shown on the Web page. The default interval is the time from the
first to last data point recorded by the data loggers on your SmartServer.
• Click Clear Log Interval to clear the currently selected range of data
points from the Web page. Note that the Web page only shows the first
60 entries in the range, but the entire range will be deleted.
• Click Clear Entire Log to clear all the selected data points from the
Web page.
Time
Displays the date and time when the data point update occurred.
Name
Displays the name of the data point that was updated using the following
format: <network>/<channel>/<device>/<functional block>/<data point>.