Echelon Rapid Deployment Example for EES User Manual
Page 30
20
Using the Rapid Deployment Example
Using the One-Line Diagram Web Page
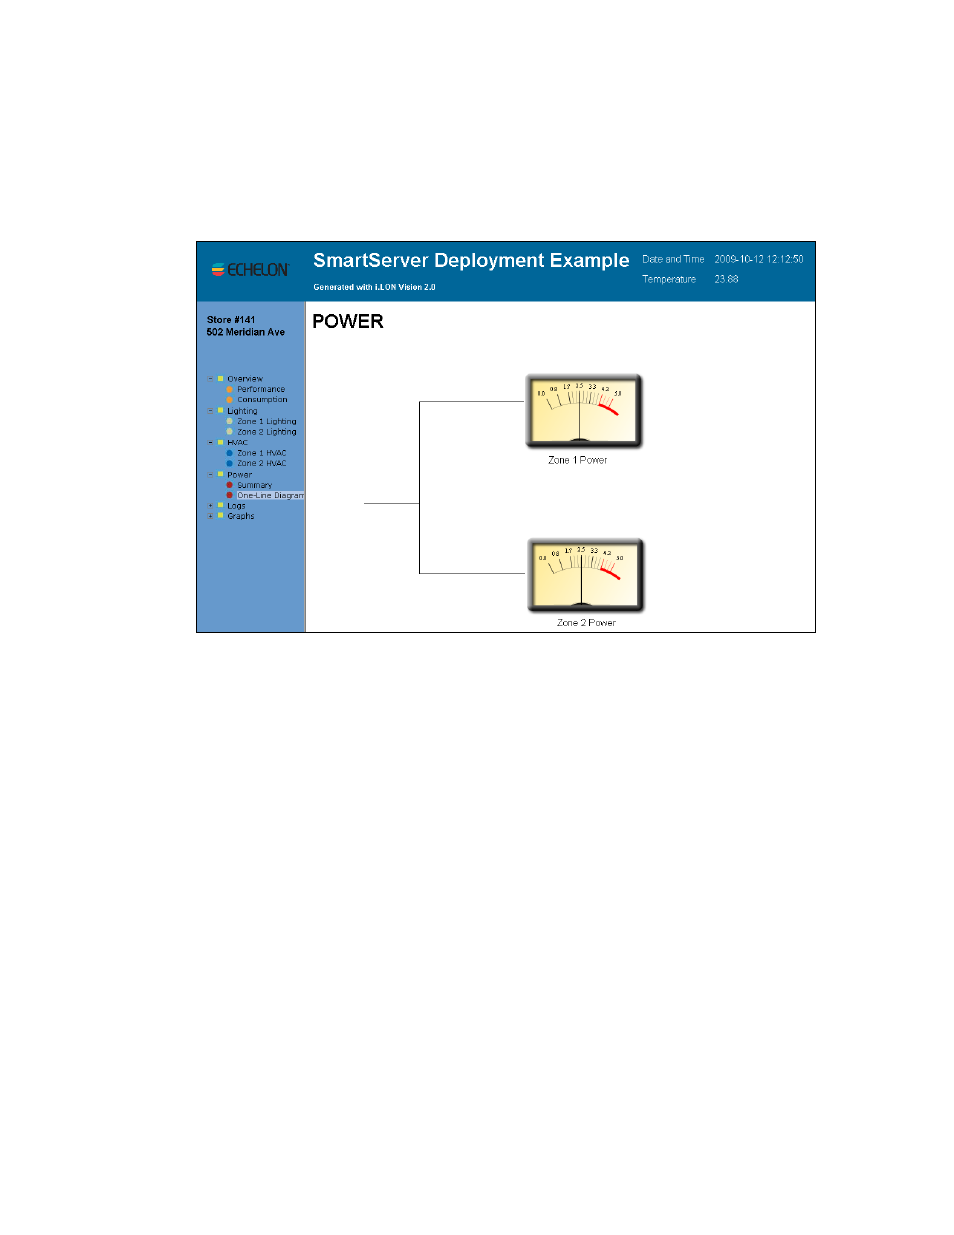
To open and use the One-Line Diagram Web page, follow these steps:
1. Expand the Power entry in the navigation pane on left side of the Web interface, and then click
One-Line Diagram.
2. The Power Web page opens.
3. This Web page displays a VU Meter image for each zone that indicates the zone’s energy
consumption in watts.
Using the Logs Web Pages
You can use the Logs Web pages to view a graph and a log that provide historical tracking of the
energy consumption (in watts), temperature, and lighting data in the selected zone. To open and use
the Logs Web pages, follow these steps:
1. Expand the Logs entry in the navigation pane on left side of the Web interface, and then click
Power, HVAC, or Lighting.
2. The Logs Web page opens.