Opening the deployment example web interface – Echelon Rapid Deployment Example for EES User Manual
Page 25
Rapid Deployment Example for EES
15
5. Use the Power Web pages to view summaries of the energy used in each zone.
6. Use the Logs Web page to view historical energy consumption, temperature, and lighting data in
each zone.
7. You can use the Graphs Web pages to view real-time data for the energy consumption (in watts),
temperature, and lighting in each zone.
Opening the Deployment Example Web Interface
To open the deployment example Web pages, follow these steps:
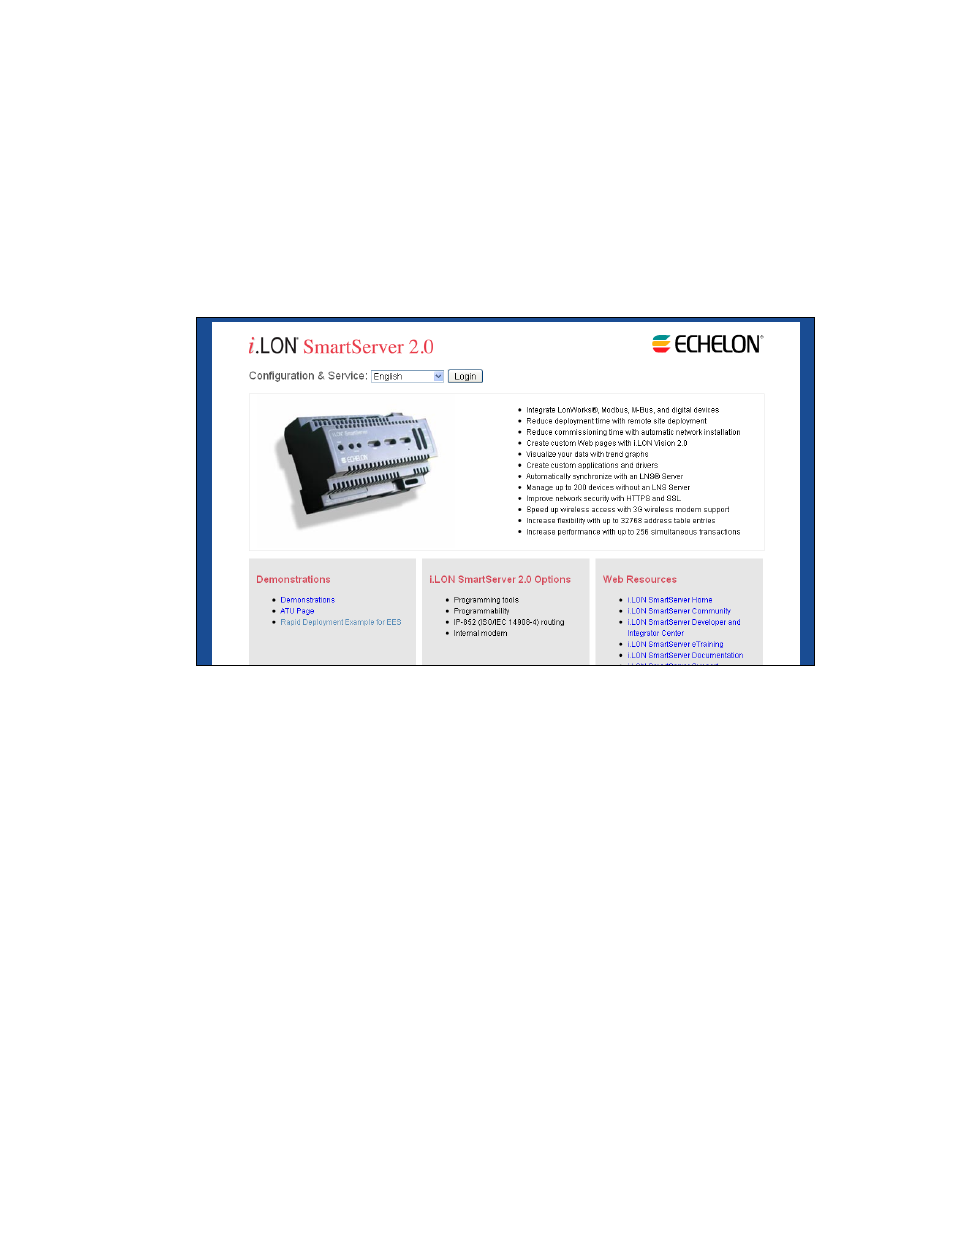
1. Open your SmartServer’s home page.
2. Click the Rapid Deployment Example for EES link under the Demonstrations box.
3. The Performance Indicators Web page opens. See Using the Performance Indicators Web Page
for more information on using this Web page.
4. You can expand the entries in the navigation pane on left side of the Web interface and then click
a link under an entry to open a Web page. The following sections describe how to open and use
the various Deployment Example Web pages.
Using the Overview Web Pages
You can use the Overview Web pages to view the network’s performance indicators and monitor the
network’s real-time energy consumption.
Using the Performance Indicators Web Page
You can use the Performance Indicators Web page to view whether the network is meeting corporate
standards. To open and use the Performance Indicators Web page, follow these steps:
1. Expand the Overview entry in the navigation pane on left side of the Web interface, and then click
Performance Indicators.
2. The Performance Indicators Web page opens.