USL LSS-100 User Manual
Page 14
LSS−100P Installation & Operation Manual
14
Figure 15 - LSS-100P CSV Data
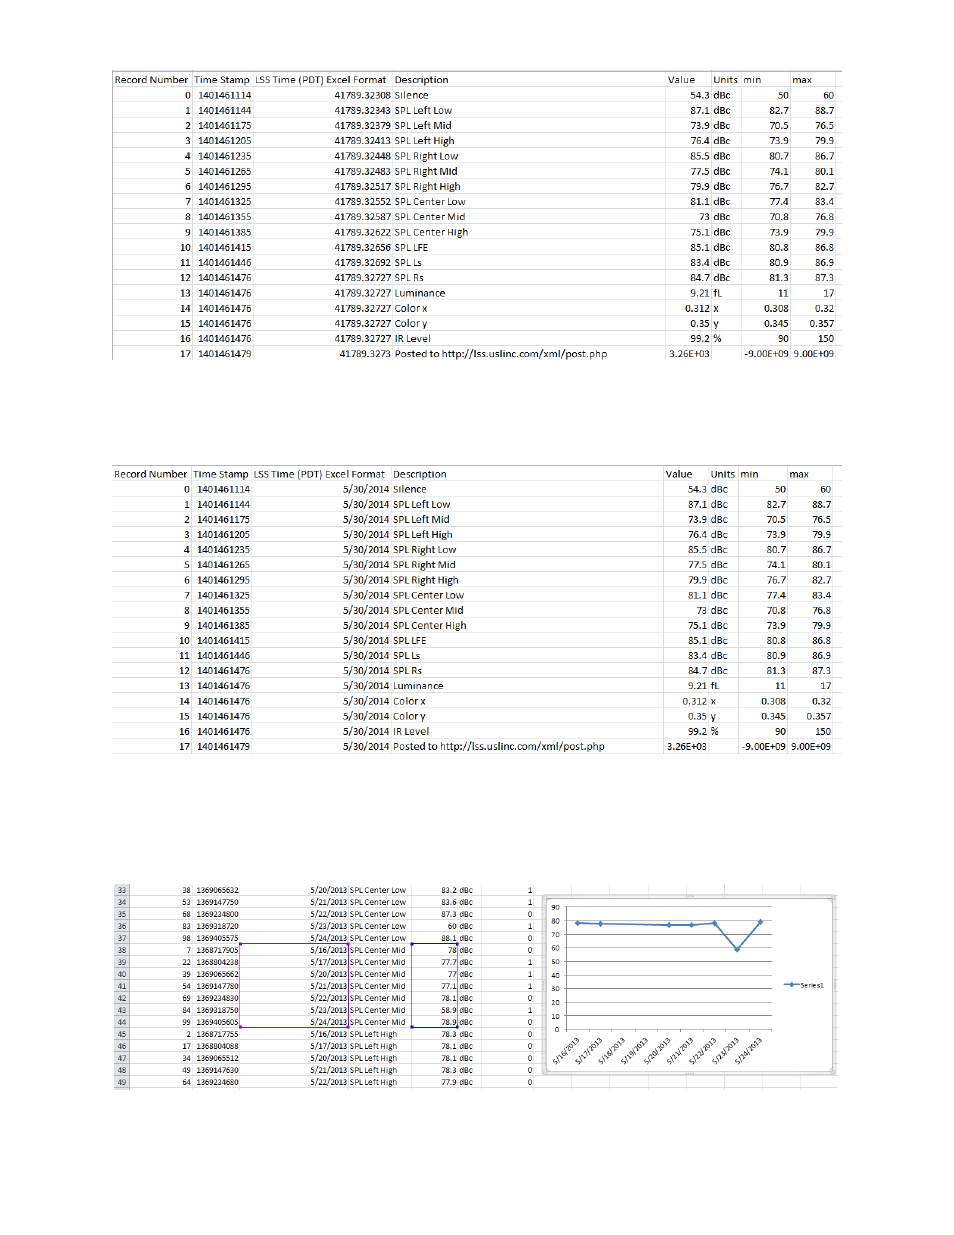
Change the format of column C (LSS Time) to date. The result is shown below:
Figure 16 - LSS-100P CSV with Local Time Converted
Sort the spreadsheet on column D (description) to gather like readings together. Graphing or analysis
can then be easily accomplished. The image below shows the generation of a plot of the SPL from the
center channel mid-band measurements.
Figure 17 – Graph Generation from LSS-100P CSV Data