Data analysis – USL LSS-100 User Manual
Page 13
LSS−100P Installation & Operation Manual
13
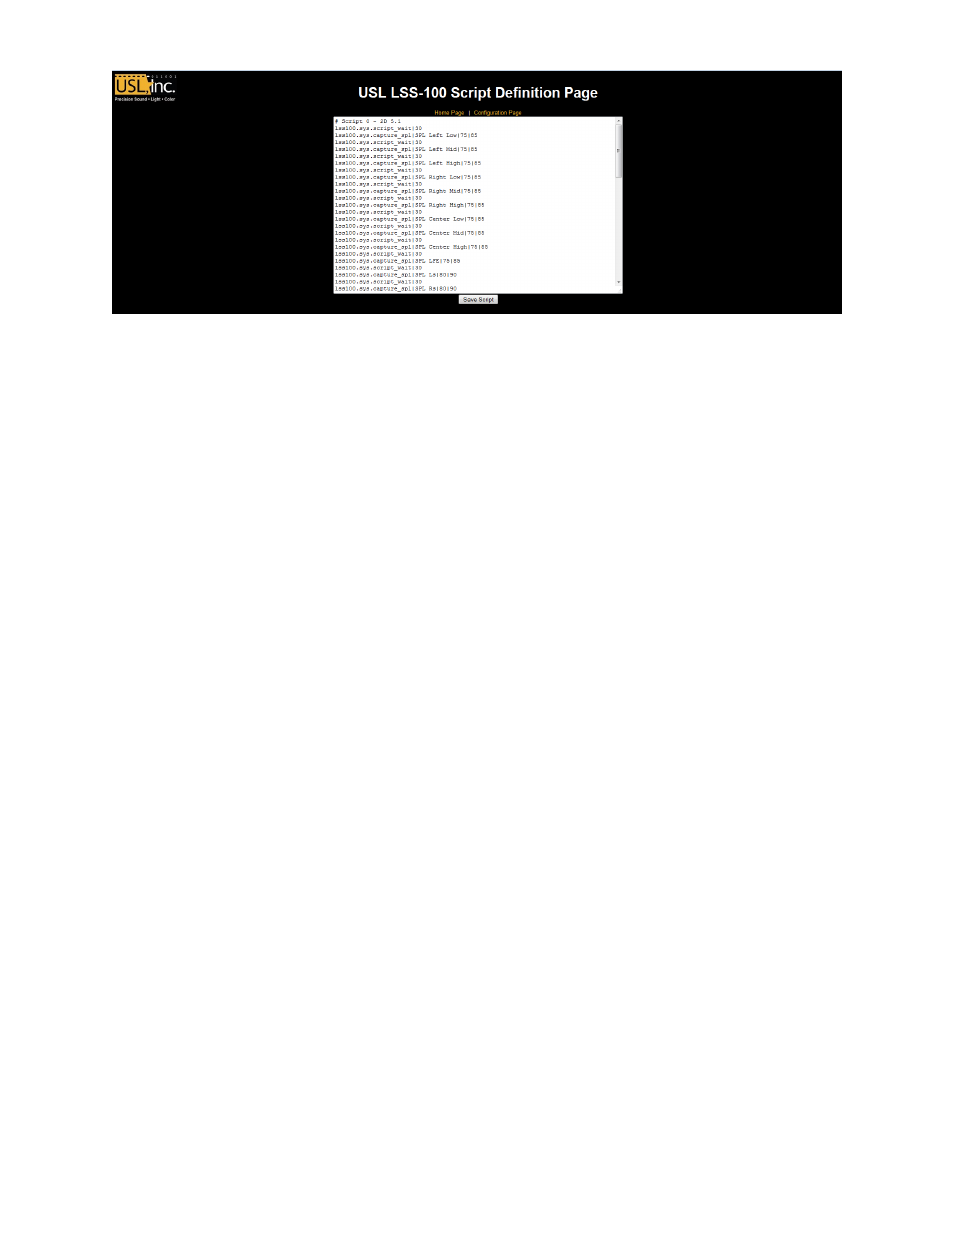
Figure 14 - LSS-100P Command Script Page
10. Click the “Save Script” button to save the revised script.
11. Run the test show a couple times and review the log. It should appear similar to figure 2 but
with the latest values not in red. Measured values that are not between the specified minimum
and maximum are shown in red.
12. Click on a value in the log. A graph of the measured values (similar to figure 3 but with fewer
values) should appear. If the test script has only run once, no graph will appear. At least two
measurements are required to draw the graph.
Data Analysis
The LSS-100P presents the captured data in a log (as shown in figure 2) and a graph (as shown in figure
3). Out of limit operation is easily identified in the log by a value being printed in red. The graphs show
the measured values along with limit lines allowing easy detection of trends and out of limit operation.
Log data is also available as a Comma Separated Value file for analysis in a spreadsheet. Click the CSV
link at the bottom of a log page to get the CSV log.
Log data can also be posted to a web server as XML for further analysis and consolidation with data from
other sites.
CSV Data Use
Click CSV to download the log as a comma separated value file for importing the data into a
spreadsheet. A portion of a typical download is shown below.