Creating an analysis – Cannon Instrument CAV-2000 User Manual
Page 34
28
CANNON
®
Automatic Viscometer Models CAV-2100 and CAV-2200 with VISCPRO
®
Instruction & Operation Manual
Version 2g — May, 2009; CANNON
®
Instrument Company
2139 High Tech Road • State College, PA 16803 • USA
Standard VI Table—provides a report of matched samples accord-
ing to configuration information you provide.
Error Log Table–lists error messages and related data.
Error Data, Sample Data and VI Data Export Analyses–config-
ures data for output to a file, parallel port, or serial port.
Creating an analysis
The following procedure creates a standard CAV Data Table which will
be updated as samples are tested. For additional information on analyses,
consult the manual chapter corresponding to the desired analysis.
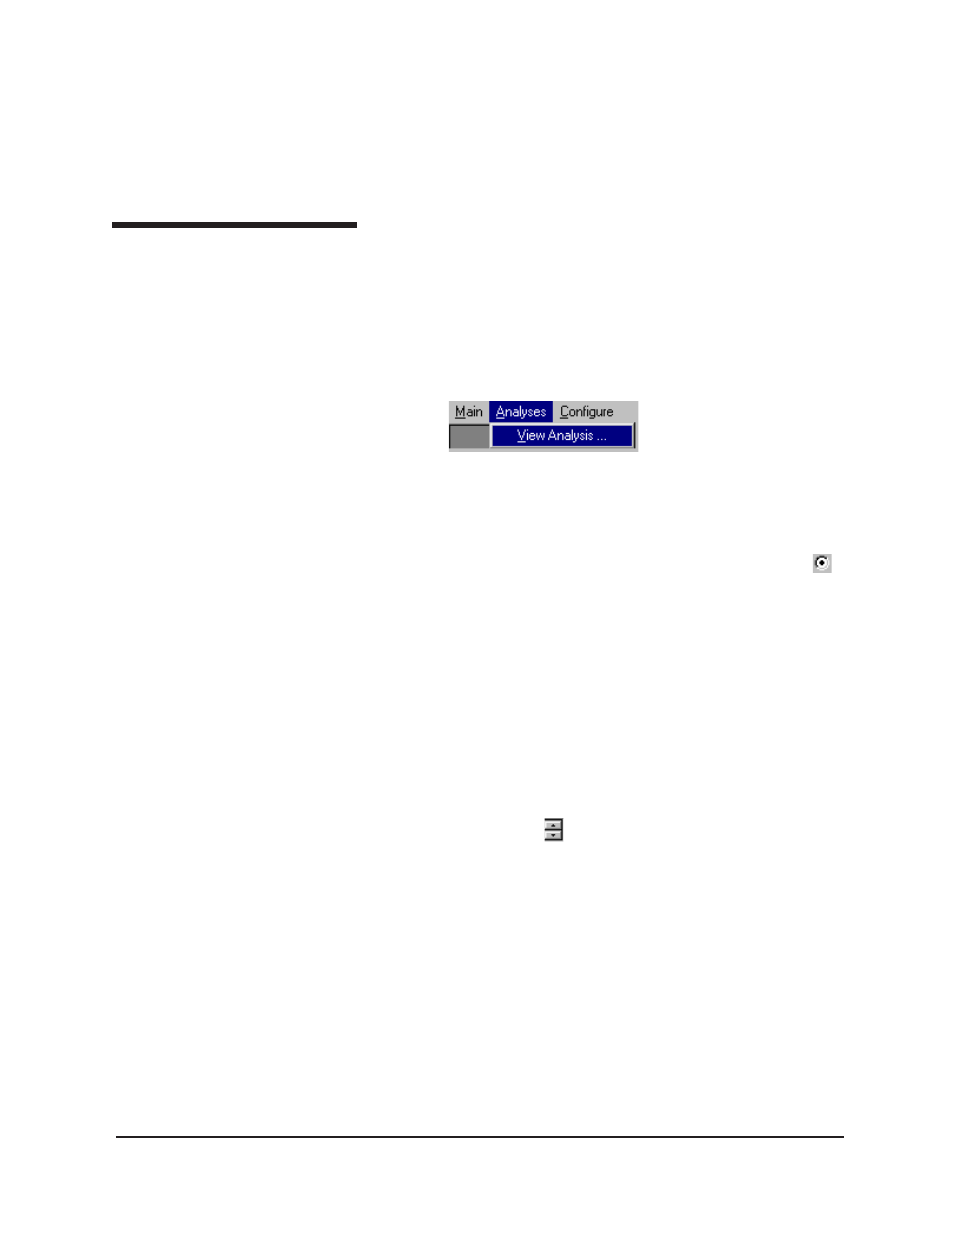
1. Select Analyses from the VISCPRO
®
primary menu options.
2. Select View Analysis ... from the Analyses menu. The Choose
Analysis window will appear.
3. Double-click on Basic Package.
4. Click on CAV Data Table to reveal the available analyses.
5. Click on the Define and Open New Configuration radio button
(or verify that the option is selected).
6. Click OK. The Sample Analysis Configuration window will
appear. The Sample Analysis Configuration window consists of
tabbed pages with filter options appropriate for the analysis.
7. Click on Date Filter and then click the Use Dynamic Update check
box. This option will update the displayed analysis with new data as
samples are tested.
NOTE
For additional information on analysis filter options, consult the manual
chapter corresponding to the desired analysis.
8. Click on the spin controls
to select a value for the sample time
window (the time parameter you desire for the report of recent test
data).
9. Configure any other report options (see Chapter 7 for details). Then
click OK. The program will prompt you to save the analysis configu-
ration.
10. Click Yes. (OR click NO to display the analysis without saving it.)
11. If Yes was selected, use your keyboard to type the name you wish to
use for the analysis in the text box.
12. Click OK. The analysis will be saved and data obtained during the
selected time window will be displayed.