Vernier LabQuest 2 User Manual
Page 7
Getting Started with LabQuest 2
3
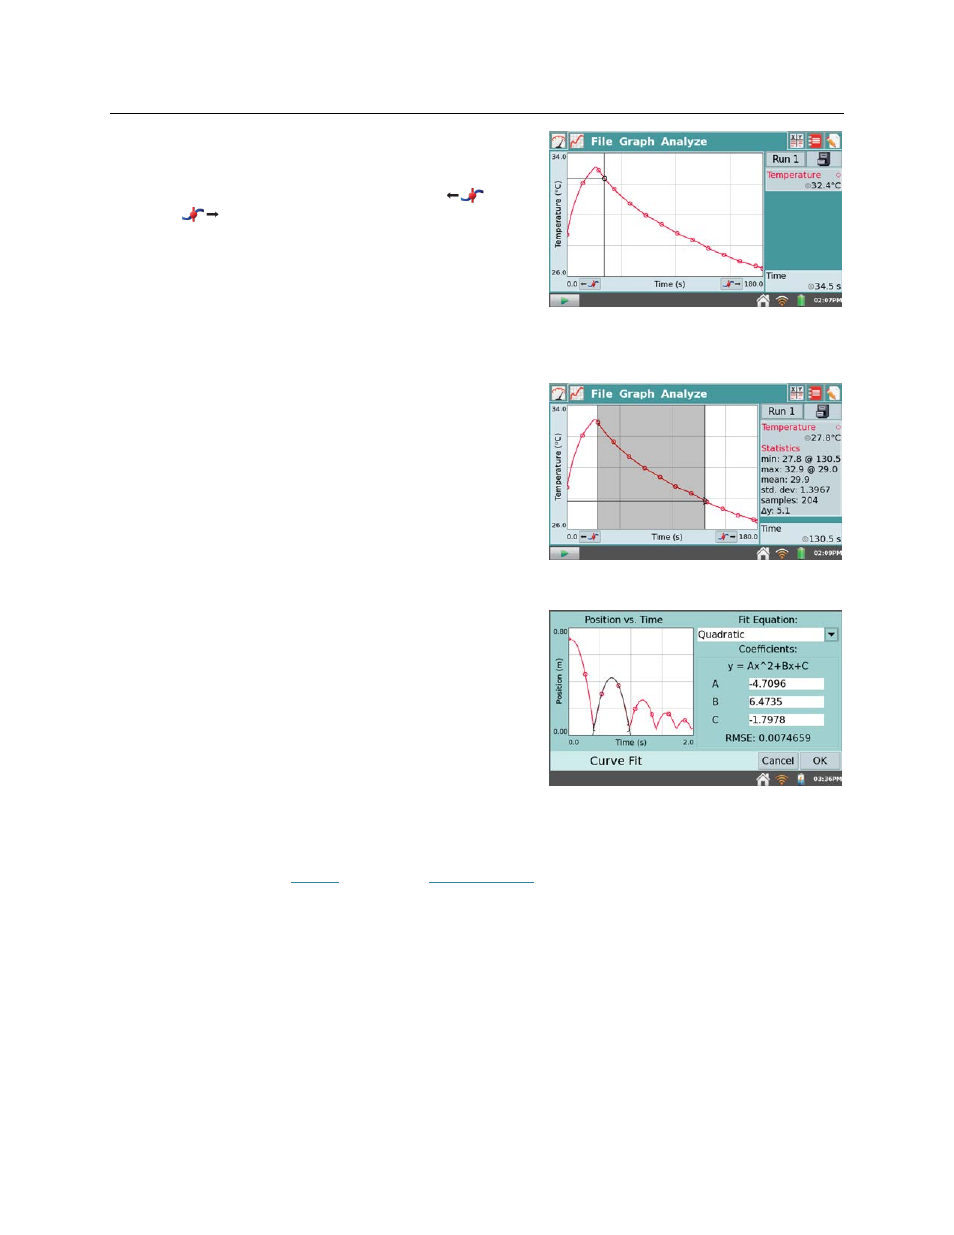
4. Tap the graph to examine a point of interest. The
coordinates of the point are shown in the panel to
the right of the graph. Tap another point or tap the
Examine buttons to move the cursor left
and
right
.
5. To select a region of data for analysis, tap-and-drag across the graph to highlight the desired
region. Note: To analyze all data, you do not need to select a region.
Statistics
To view statistics for the selected data on the Graph
screen, choose Statistics from the Analyze menu.
Select the check box to select a data set. The
statistics information is then displayed in the panel
to the right of the graph.
To remove the displayed statistics, tap Analyze on
the Graph screen, choose Statistics, and then select
the checked box to clear the selection.
Curve Fit
To fit a curve to the selected data on the Graph
screen, choose Curve Fit from the Analyze menu.
Select the check box to select a data set. Tap Choose
Fit and choose the desired fit equation. LabQuest
automatically determines and displays the fit
coefficients, and displays a preview of the curve fit
on the graph. Tap OK to apply the fit and return to
the Graph screen.
To remove the fit, choose Curve Fit from the Analyze Menu, and then select the checked box
to clear the selection.
Note: The Curve Fit coefficients cannot be manually adjusted. To enter your own
parameters, see the
tool within