Vernier LabQuest 2 User Manual
Page 28
24
•
New Manual Column
– New Manual Column
creates an empty column where you can enter or
generate values directly. You can add a manual
column to a data set that includes sensor data, or
you can create a new data set consisting entirely
of manually entered data.
•
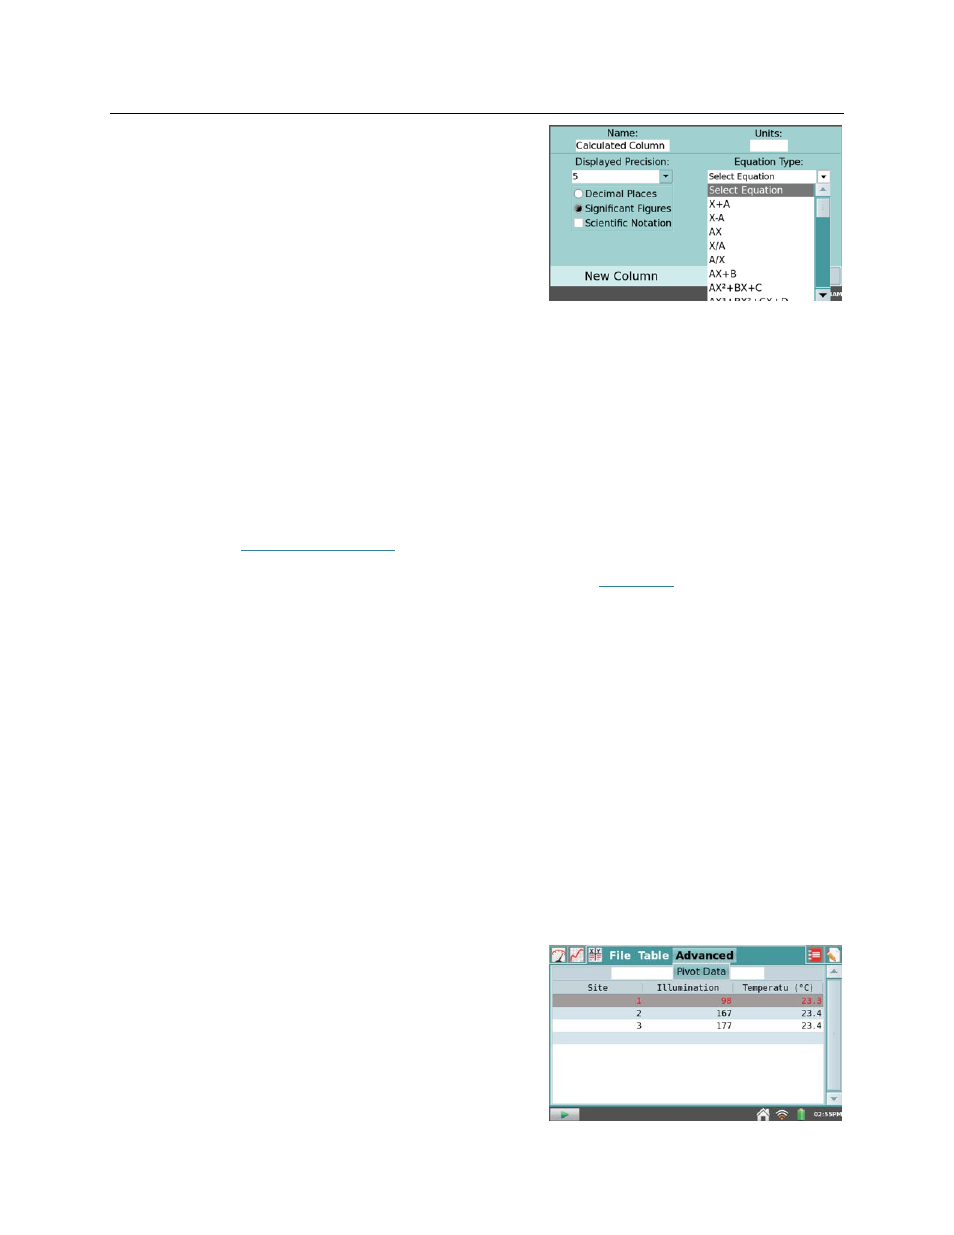
New Calculated Column
– New Calculated
Column creates a new column whose values are
based on other columns by a mathematical formula. Tap the Name field to enter a name
for the new column, tap the Units field to enter the units, and then select an equation from
the Equation Type list. For example, you might define a calculated column as the inverse
square of another column. After creating a calculated column, you can display the
calculated data on a graph, or manipulate it further with additional calculated columns.
•
Data Column Options
– This allows you to access the fields for setting the column name,
units, and displayed precision. Alternatively, you can access these fields by tapping on
the column name from the Table screen.
•
Delete Data Column
– This allows you to delete a manual or calculated column of data.
Note that you cannot delete data collected from a sensor; however, you can hide data
using the
• Delete Run –
If you have stored at least one run using the
be available in the Table menu. Upon choosing Delete Run, tap the desired run name to
delete the run. You will not be able to delete the last run created.
•
Clear All Data
– This action will clear all data in the table. Upon choosing this option, you
will be prompted to confirm. This option is used when you wish to clear previously
collected data without changing any of the data collection parameters or sensor setup
information.
•
Strike Through Data and Restore Data
– Use these tools to ignore/restore selected data.
Struck data are ignored for analysis and graphing, and the graph will update accordingly.
To restore all data, choose Restore Data from the Table menu. Note that you can also
access these tools from the Graph menu on the Graph screen.
•
Tag Data
– Use this tool to tag a data point with a comment. After selecting the data point
within the table, choose Tag Data from the Table menu. A circle will be displayed on the
Graph screen to “tag” the data. To add a comment, tap the Graph tab, then tap the info
panel to the right of the graph. A list of Data Tags will be displayed. Tap in the blank
field to enter a comment for the tag.
•
Edit
– This tool allows you to copy and paste
values from one location to another. In
particular, you might copy a range of values
from the table and paste them into notes on the
Notes screen.
Additionally, when LabQuest is in the Data Matrix
mode, an Advanced Menu is displayed adjacent to the
Table menu. Choose
Pivot Data
from the Advanced