Data analysis – Vernier LabQuest 2 User Manual
Page 22
18
•
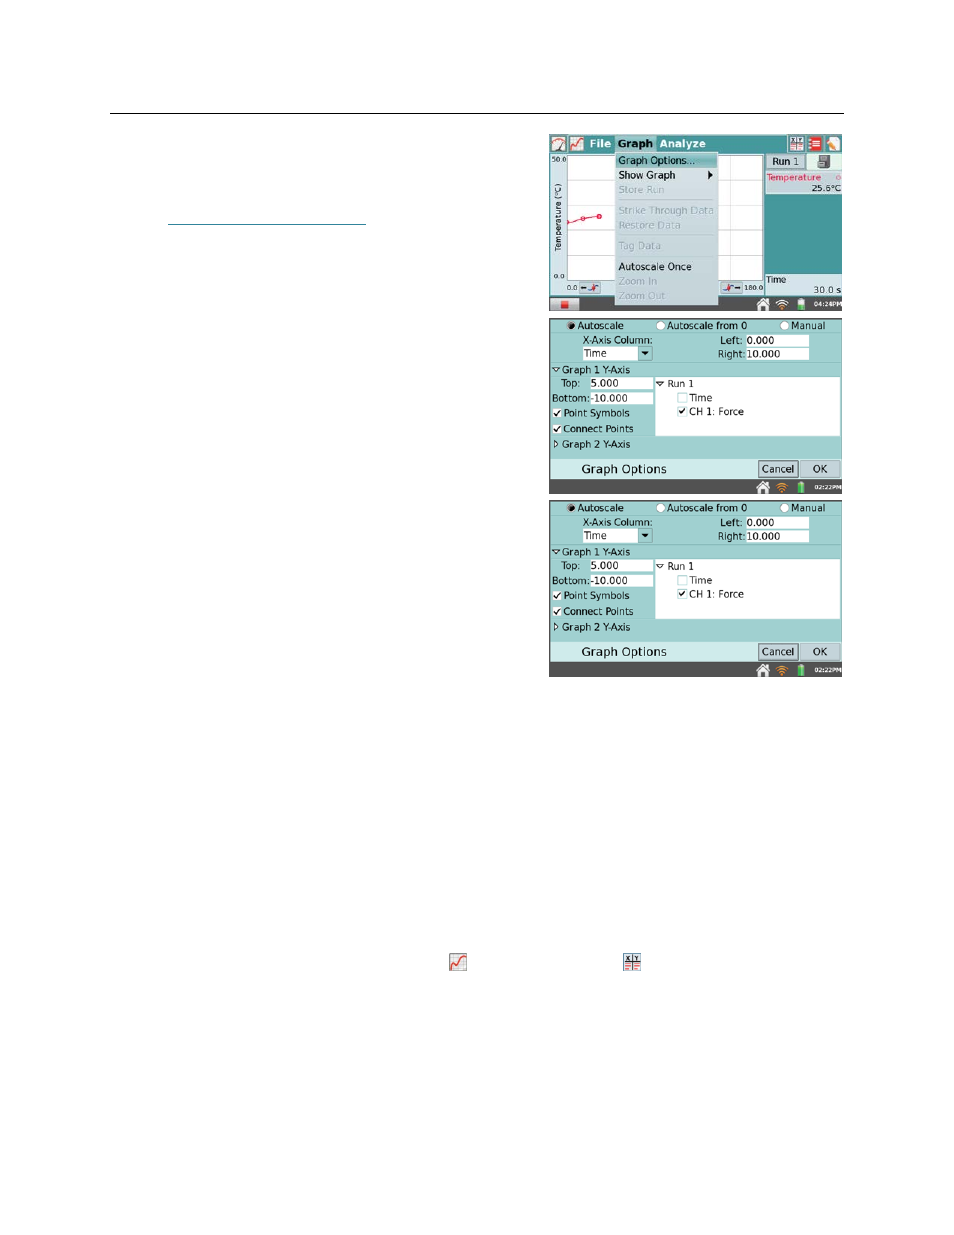
Graph Options
– To control how the data are
graphed, choose Graph Options from the Graph
menu. Here you can choose the columns used
for the x- and y-axes and the axes limits. See
Select Autoscale to adjust to the data range after
data collection ends. Autoscale from 0 does the
same, but includes the origin. Manual scaling
will respect values entered in the range limits,
unless incoming data falls outside the range. In
this case, the range will expand to include the
data. To enter range limits, tap in each field and
use the keyboard to enter numeric values.
The Point Symbols option is selected by
default, and will surround some, but not all, of
the points with a mark (e.g., a circle or triangle).
This allows easy identification of a trace by the
corresponding mark in the graph legend. Select
the checked box to disable this feature.
The Connect Points option connects data points
with straight-line segments. These lines help the
eye follow the data trend, but in some cases are
not appropriate. Select the checked box to disable this feature.
From this screen, you also select the data to be graphed. For the x-axis, choose the
desired column from the X-Axis Column dropdown menu. For the y-axis, select one or
more columns from the run(s) listed under the expanded Graph 1 Y-Axis field.
LabQuest can display a single graph, or two graphs sharing a common x-axis and range.
Tap the triangle next to Graph 1 Y-Axis or Graph 2 Y-Axis to show or hide the settings
for that axis. If no column is selected for Graph 2, only one graph will be drawn.
When you are done setting Graph Options, tap OK to return to the Graph screen.
Data Analysis
You can analyze data from the Graph screen
or the Table screen
. LabQuest analysis
features are described in greater detail, below.
Examining Data on the Graph Screen
To examine data on the Graph screen, tap on a data point of interest. The Examine cursor jumps
to the data point with the nearest x-value. Cursor lines highlight the x- and y-axis values, and the
right-side readouts display the associated numerical values of the examined point. You can make