Cardioperfect webstation user manual, Display markers, Display st slopes – Welch Allyn CardioPerfect Webstation 2.0 - User Manual User Manual
Page 21
CardioPerfect Webstation User Manual
DIR 80016200 Rev. A
- 21 -
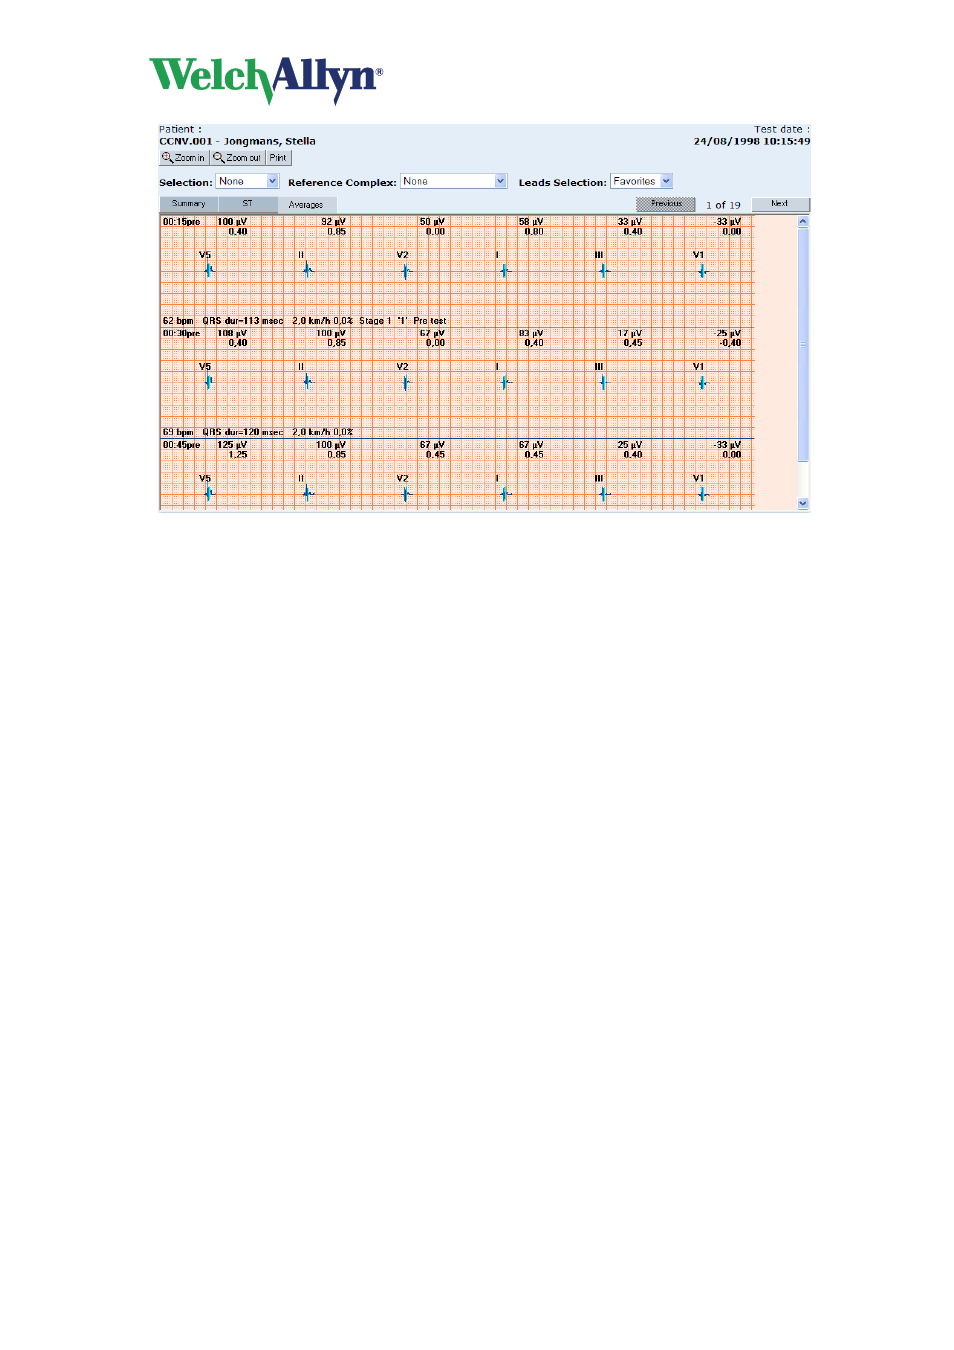
For each point, the averaged complexes are displayed, together with the patient's heart rate,
the QRS duration, the workload (in case of an ergometer test) or speed and elevation (in case
of a treadmill test), the phase and the blood pressure. The ST levels and slopes are displayed
above the complexes.
To select which six leads you want to view:
1. Click the I-aVF button to display the averages of leads I to aVF.
2. Click the V1-V6 button to display the averages of leads V1 to V6.
3. Click the I-III,V1-V6 button to display the averages of leads I to V6.
4. Click the Favorites button to display the lead preference that was set in the exercise
ECG settings.
Display markers
Markers indicate where in the QRS complex the measurement reference points have been
set. These reference points are automatically calculated. Markers can only be displayed in
the Averages tab.
Welch Allyn CardioPerfect Webstation Exercise ECG shows markers at the following points:
•
Q
QRS onset
•
J
QRS end
•
J+x
ST measurement point
Display ST slopes
Welch Allyn CardioPerfect Webstation Exercise ECG not only measures ST levels, but can
also calculate the value of ST slopes. The ST slope value gives additional qualitative