Visualization on the instrument – JUMO 706581 LOGOSCREEN nt Data Sheet User Manual
Page 8
2009-12-11/00504652
Data Sheet 70.6581
JUMO GmbH & Co. KG • 36035 Fulda, Germany
Page 8/18
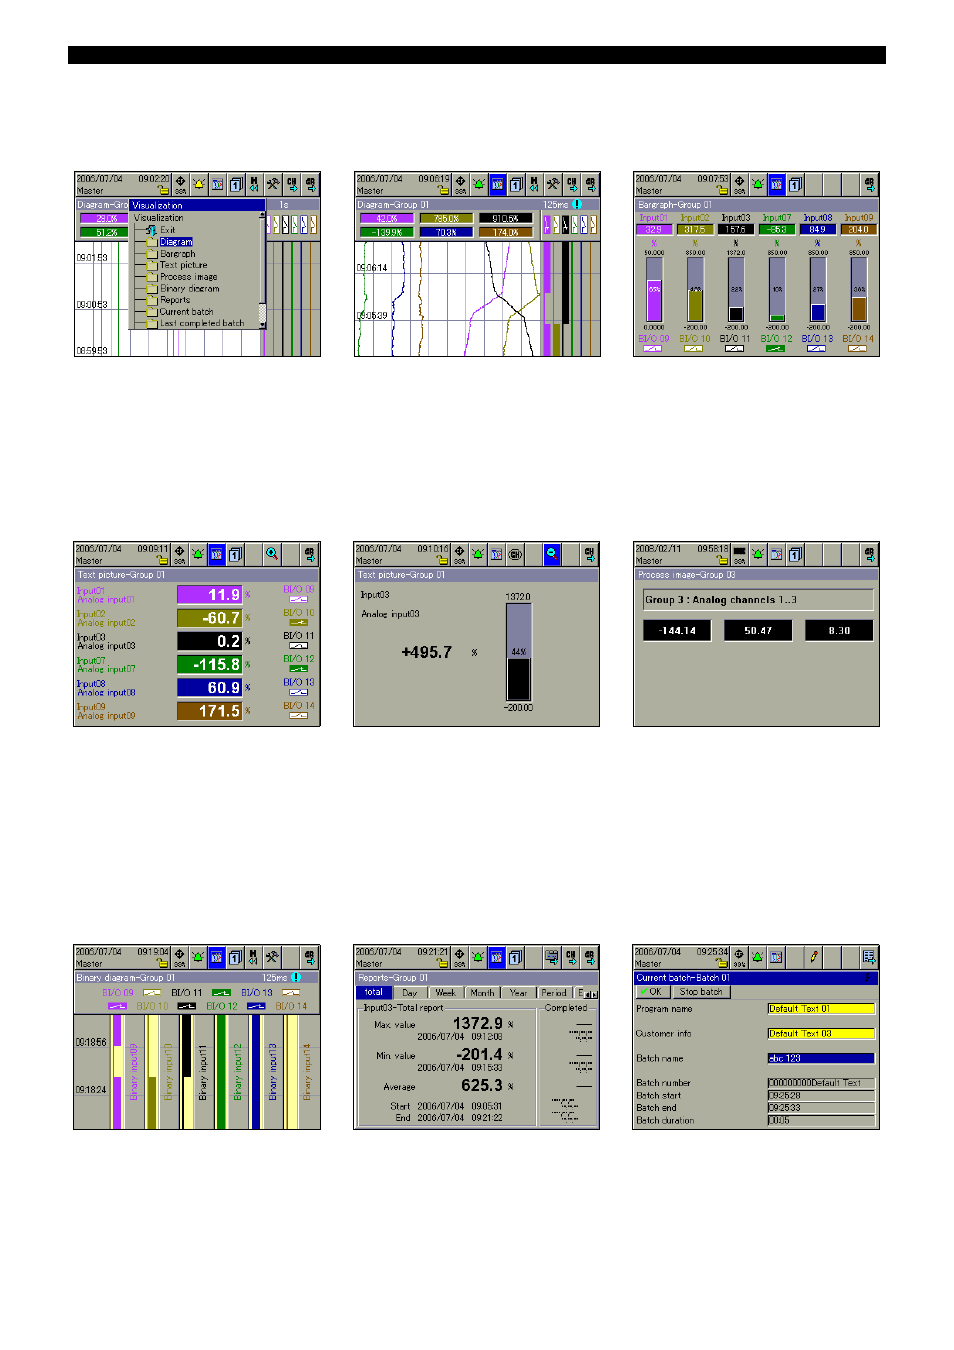
Visualization on the instrument
Operator level
k Selection of visualization
Vertical diagram
k Recorder chart presentation of
analog and binary channels
k Display of scaling and
limit markers of a channel
(can be switched on/off)
k Numerical display of current
analog channels
Bar graph presentation
k Bar graph presentation of analog
channels
k On/Off presentation of binary channels
k Display of current analog channels with
scaling and limit markers
k Color change of bar graph to red when
limits are infringed
Numerical presentation
k Large numerical presentation of
analog channels, including the channel
name and description
k Each analog channel can be
switched to the foreground
k On/Off presentation of binary channels
Numerical 1-channel presentation
k Clear presentation of an
analog channel
k An analog input is shown
simultaneously as a bar graph and a
number
k Display of channel name and
description
k Display of scaling and
limit markers
Process image
k Freely configurable presentation
(through the setup program) of analog
and binary signals with background
pictures
k One process image for each group
Binary presentation
k On/Off presentation of binary channels
Report
k Display of different reports for the
analog channels of a group
k Details of minimum, maximum,
average/integral values and time period
k Display of the previous report
Batch reports
k 3 batches documented simultaneously
k Changeover between current and
completed batch reports
k Electronic signature is possible
k Batch texts via interface and barcode
reader, among others