Dakota Ultrasonics PVX User Manual
Page 29
PVX Precision Visual Thickness Gauge
25
Diagram 2
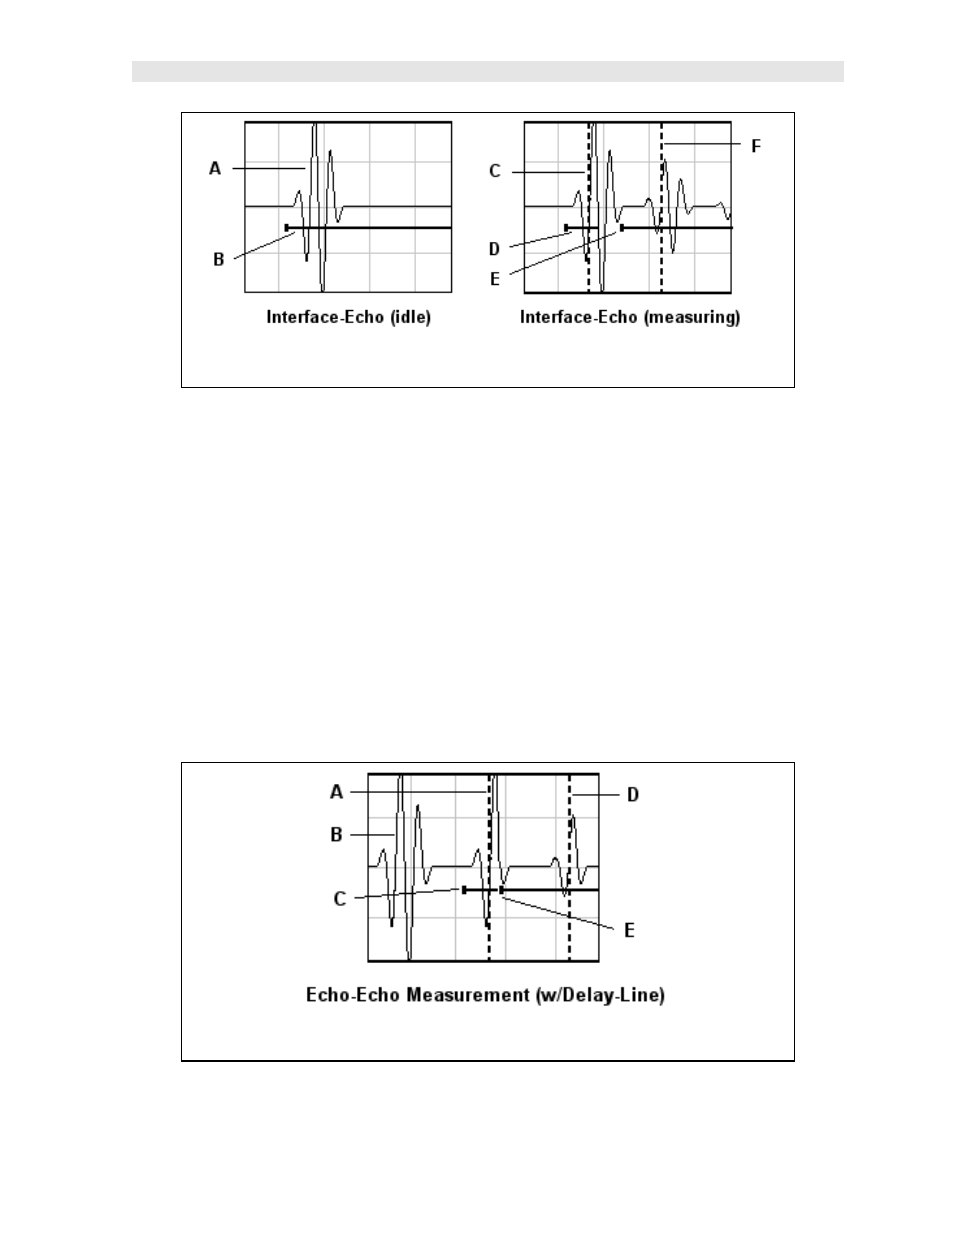
Refer to diagram 2. Referring to (Idle), you’ll notice that when the PVX is in
interface-echo mode a waveform from the end of the delay line will always be
displayed and active on the screen when idle (A). Since the gates are also used in
interface-echo mode, they will be displayed (B). When measuring, two detects will be
displayed between two waveforms at (C) & (F). The measurement starts at (C), the
end of the delay line, and measures to the back wall of the test material at (F). Point
(D) represents the gate 1 start position, and (E) the gate 2 hold-off. Notice that the
start position of the gate 2 hold-off (E) has been adjusted to the right of the delay line
waveform. This is done to avoid potential detection on the ring down of the delay line
interface, and allow a detection to occur on the back wall of the test material at (F).
Diagram 2