13 time domain information, Figure 29. time domain analysis, Cdb5484u – Cirrus Logic CDB5484U User Manual
Page 35
CDB5484U
DS919DB5
35
2.8.1.13
Time Domain Information
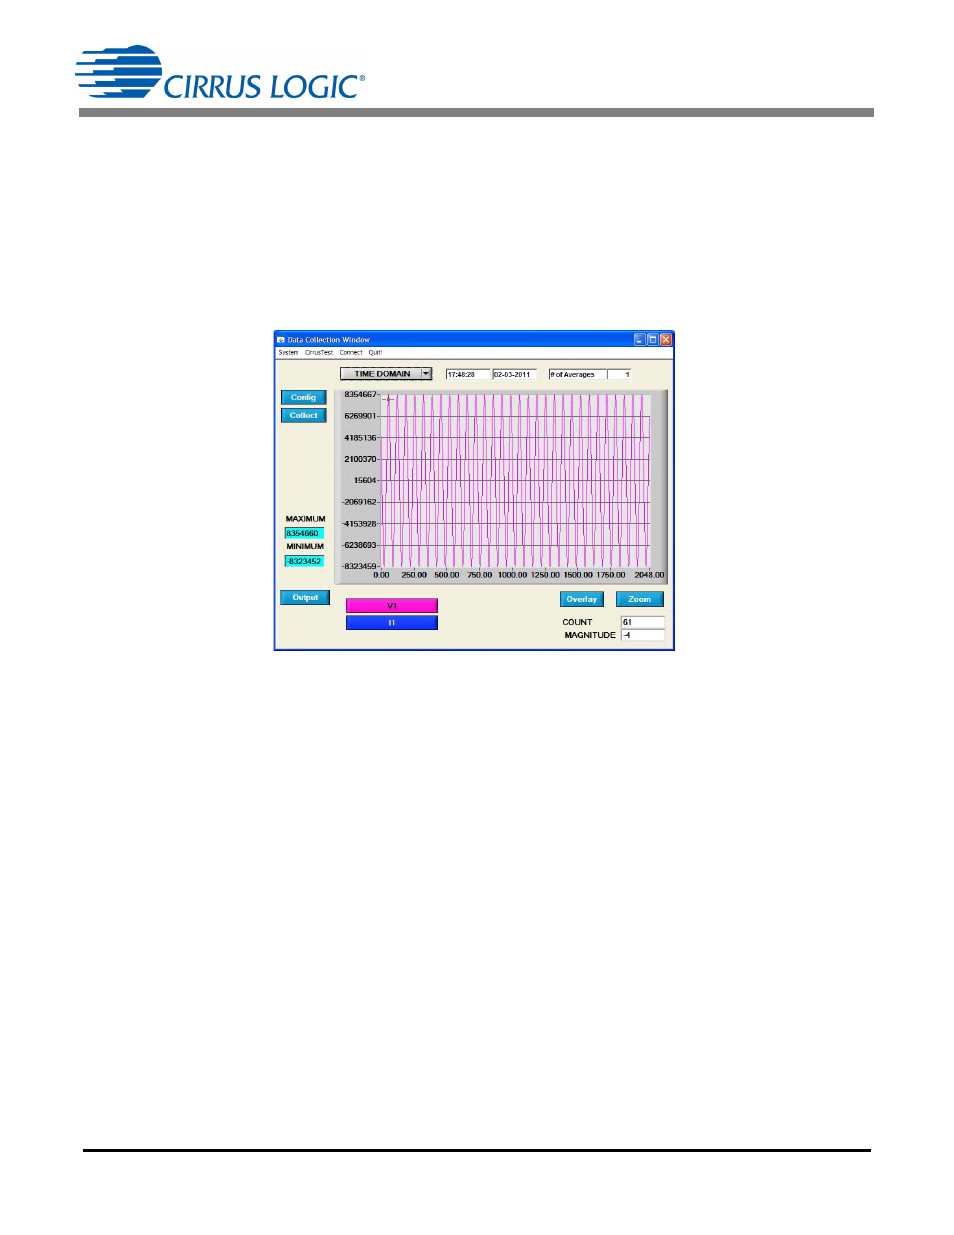
The following controls and indicators are associated with time domain analysis. Time domain data can be
plotted in the Data Collection window by setting the analysis type selector to Time Domain (see
Figure 29). The time domain plot includes:
• COUNT: Displays current x-position of the cursor on the time domain display.
• MAGNITUDE: Displays current y-position of the cursor on the time domain display.
• MAXIMUM: Indicates the maximum value of the collected data set.
• MINIMUM: Indicates the minimum value of the collected data set.
Figure 29. Time Domain Analysis
See also other documents in the category Cirrus Logic Hardware:
- CobraNet (147 pages)
- CS4961xx (54 pages)
- CS150x (8 pages)
- CS1601 (2 pages)
- CS1501 (16 pages)
- CS1601 (16 pages)
- CS1610 (16 pages)
- CRD1610-8W (24 pages)
- CRD1611-8W (25 pages)
- CDB1610-8W (21 pages)
- CS1610A (18 pages)
- CDB1611-8W (21 pages)
- CDB1610A-8W (21 pages)
- CDB1611A-8W (21 pages)
- CRD1610A-8W (24 pages)
- CRD1611A-8W (25 pages)
- CS1615 (16 pages)
- AN403 (15 pages)
- AN401 (14 pages)
- AN400 (15 pages)
- AN375 (27 pages)
- AN376 (9 pages)
- CRD1615-8W (22 pages)
- CRD1616-8W (23 pages)
- AN402 (14 pages)
- AN404 (15 pages)
- CRD1615A-8W (21 pages)
- CS1615A (16 pages)
- CS1630 (56 pages)
- AN374 (35 pages)
- AN368 (80 pages)
- CRD1630-10W (24 pages)
- CRD1631-10W (25 pages)
- CS1680 (16 pages)
- AN405 (13 pages)
- AN379 (31 pages)
- CRD1680-7W (31 pages)
- AN335 (10 pages)
- AN334 (6 pages)
- AN312 (14 pages)
- AN Integrating CobraNet into Audio Products (16 pages)
- CobraNet Audio Routing Primer (9 pages)
- Bundle Assignments in CobraNet Systems (3 pages)
- CS2300-01 (3 pages)
- CS2000-CP (38 pages)