12 frequency domain information, Figure 27. histogram analysis, Figure 28. fft analysis – Cirrus Logic CDB5484U User Manual
Page 34: Cdb5484u
CDB5484U
34
DS919DB5
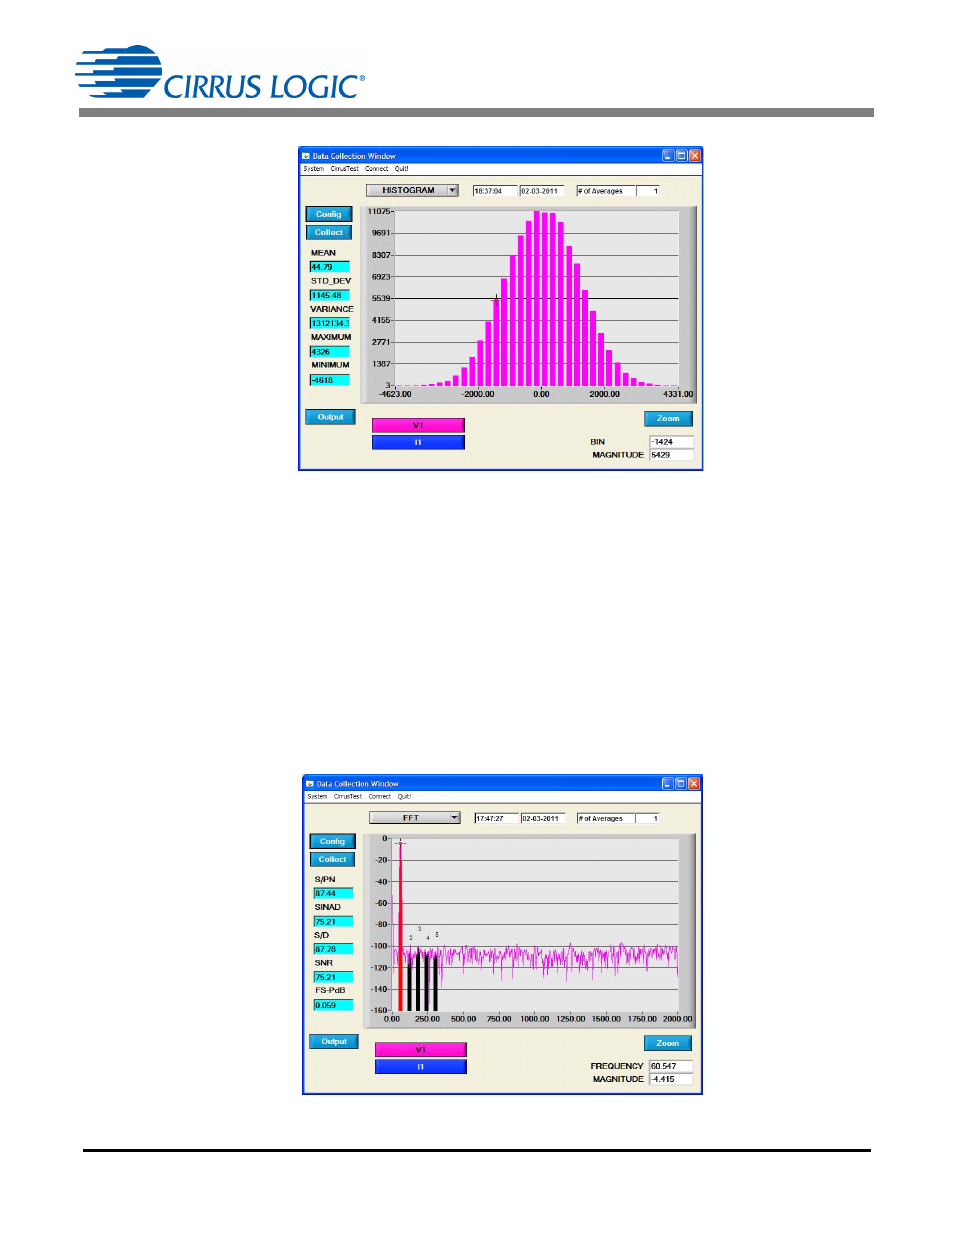
Figure 27. Histogram Analysis
2.8.1.12
Frequency Domain Information
The following describes the indicators associated with FFT (Fast-Fourier Transform) analysis. FFT data
can be plotted in the Data Collection window by setting the analysis type selector to FFT. See Figure 28.
The FFT information includes:
• FREQUENCY: Displays the x-axis value of the cursor on the FFT display.
• MAGNITUDE: Displays the y-axis value of the cursor on the FFT display.
• S/PN: Indicates the signal-to-peak noise ratio (decibels).
• SINAD: Indicates the signal-plus-noise-plus-distortion to noise-plus-distortion ratio (decibels).
• S/D: Indicates the signal-to-distortion ratio, 4 harmonics are used in the calculations (decibels).
• SNR: Indicates the signal-to-noise ratio, first 4 harmonics are not included (decibels).
• FS-PdB: Indicates the full-scale to signal Ratio (decibels).
Figure 28. FFT Analysis