1 audio performance graphs, Audio performance graphs, Figure 33: thd+n of the vs-3232a – Kramer Electronics VS-3232A User Manual
Page 58: Figure 34: maximum input/output level at 1khz
Technical Specifications
53
53
11.1
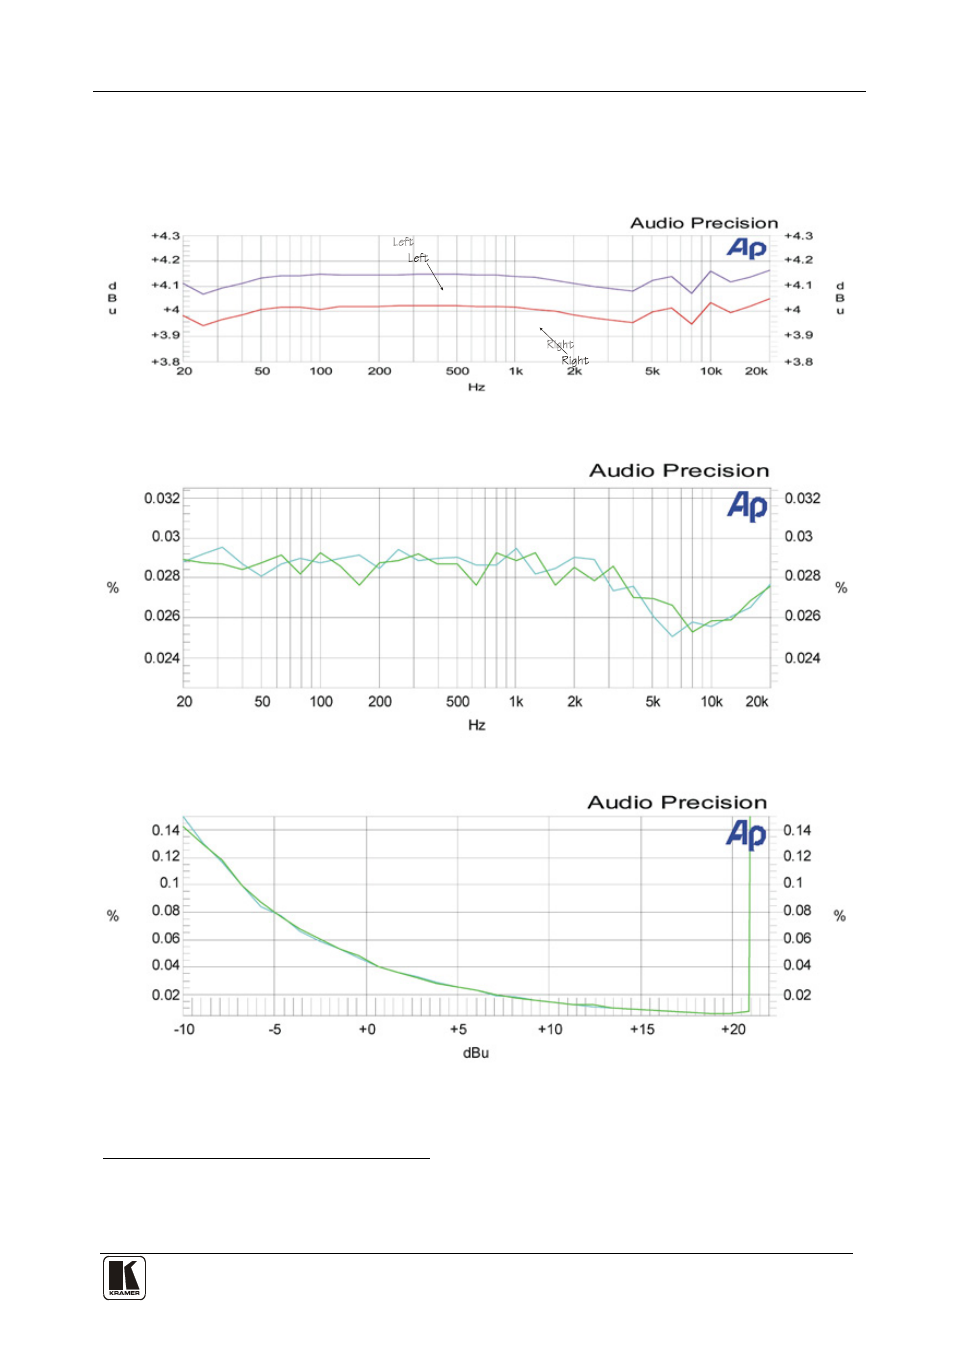
Audio Performance Graphs
This section describes the audio performance of the left and right signals
output from the VS-3232A
1,2,3
:
Out put Vol ume
Figure 32: Frequency Response (Bandwidth) of the VS-3232A
THD+N
Figure 33: THD+N of the VS-3232A
THD+N
Output Level
Figure 34: Maximum Input/Output Level at 1kHz
1 All the measurements for these graphs were taken while input 2 was switched to output 31
2 Both the input and output levels are set to 0dB
3 The input signal is +4dBu (where applicable) and the output load is 2.5k
Ω
See also other documents in the category Kramer Electronics Routers:
- VM-216H (25 pages)
- VM-28H (23 pages)
- VM-22H (12 pages)
- VM-24H (23 pages)
- VM-24HC (21 pages)
- VM-24HD (10 pages)
- VM-24HDCP (19 pages)
- VM-42 (8 pages)
- VP-222K (10 pages)
- VP-242 (8 pages)
- VP-32K (13 pages)
- VS-202YC (23 pages)
- 4x1S (15 pages)
- 4x1V (12 pages)
- 6241HDxl (10 pages)
- 6241N (10 pages)
- 6502 (12 pages)
- PT-201VGA (8 pages)
- TailorMade (21 pages)
- TailorMade (22 pages)
- VP-1201 (50 pages)
- VP-12x8 (34 pages)
- VP-1608 (46 pages)
- VS-88SDI (42 pages)
- VP-321xl (37 pages)
- VP-16x18AK (60 pages)
- VP-201xl (8 pages)
- VP-211K (15 pages)
- VP-27 (32 pages)
- VS-66HN (25 pages)
- VS-88HDxl (43 pages)
- VP-28 (42 pages)
- VP-2x2 (17 pages)
- VP-31 (25 pages)
- VP-311DVI (20 pages)
- VS-88HD (21 pages)
- VS-88HD (44 pages)
- VP-31KSi (16 pages)
- VP-81KSi (51 pages)
- VP-31KSi (48 pages)
- VP-41 (8 pages)
- VP-411DS (22 pages)
- VS-81HDxl (25 pages)
- VP-4x1CS (39 pages)
- VP-4x4K (61 pages)