Salinity and soil water data interpretation, Example 1 – Campbell Scientific Sentek TriSCAN® Manual v 1.2a User Manual
Page 44
TriSCAN Manual Version 1.2a
Copyright © 1991 – 2004 Sentek Pty Ltd All rights reserved
Page 37
Salinity and Soil Water Data Interpretation
The effect of dissolved salts on plant growth depends on their concentration in the soil solution at any
particular time or at a given soil water content. The following examples using IrriMAX 6 software
demonstrate some of the expected output from the TriSCAN sensors.
Example 1
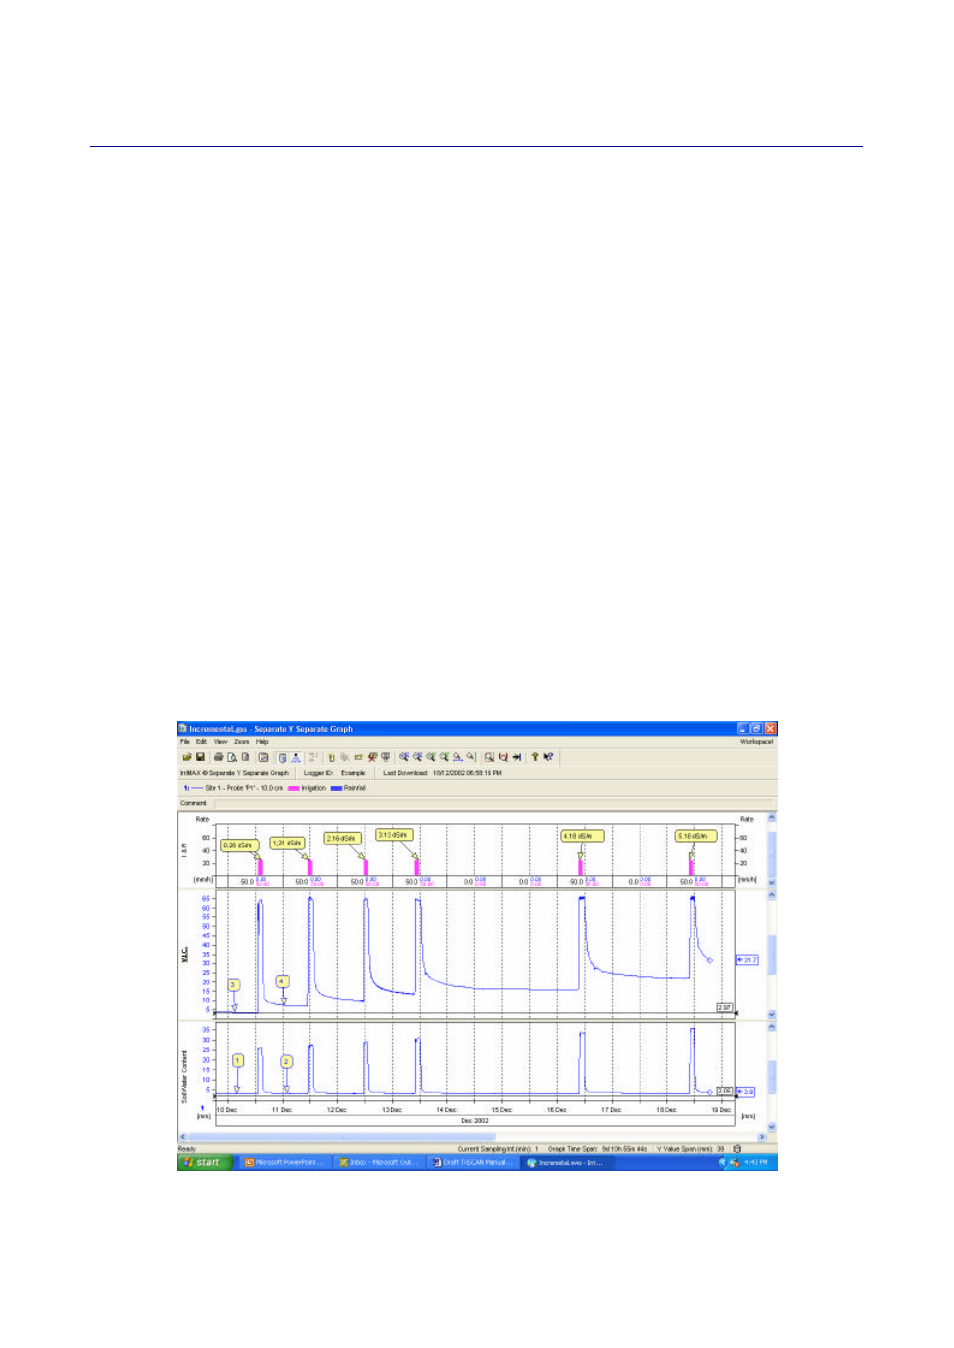
Figure 9 shows how the TriSCAN sensor output changes following a series of irrigations containing different
amounts of a common farm fertilizer (ammonium nitrate) applied to a sand column. The trend line in the
bottom window pane indicates changes in soil water content while the trend line in the centre window pane
shows salinity changes.
In the top window pane purple bars indicate irrigation events. Salinity concentration of the irrigation water is
given in deciSiemens per meter and is shown in “bubble comments” pointing to the respective irrigation.
To interpret the salinity changes on the graph, first look at the soil water trend line in the bottom window
pane to understand the soil water dynamics.
The irrigation containing ammonium nitrate with a salinity of 0.26 dSm
-1
(see bubble comment) applied on
the 10 December at field capacity (Box 1) saturates the sand column for a few hours. The sand column then
drains back to field capacity (Box 2).
Looking at the salinity trend line over the same time period, a definite rise in the trend line can be observed
after the fertigation event (refer to Boxes 3 and 4). Independent measures of salinity of soil drainage water
from the column during the box 3 period was 0.1 dSm
-1
. Drainage water salinity then rose after the irrigation
to 0.26 dSm
-1
.
Figure 9. Sensor response to fertigation