Displaying line numbers on graphs – Vaisala Spectrum 4.0 User Manual
Page 61
Veriteq Spectrum 4.0 User’s Guide
55
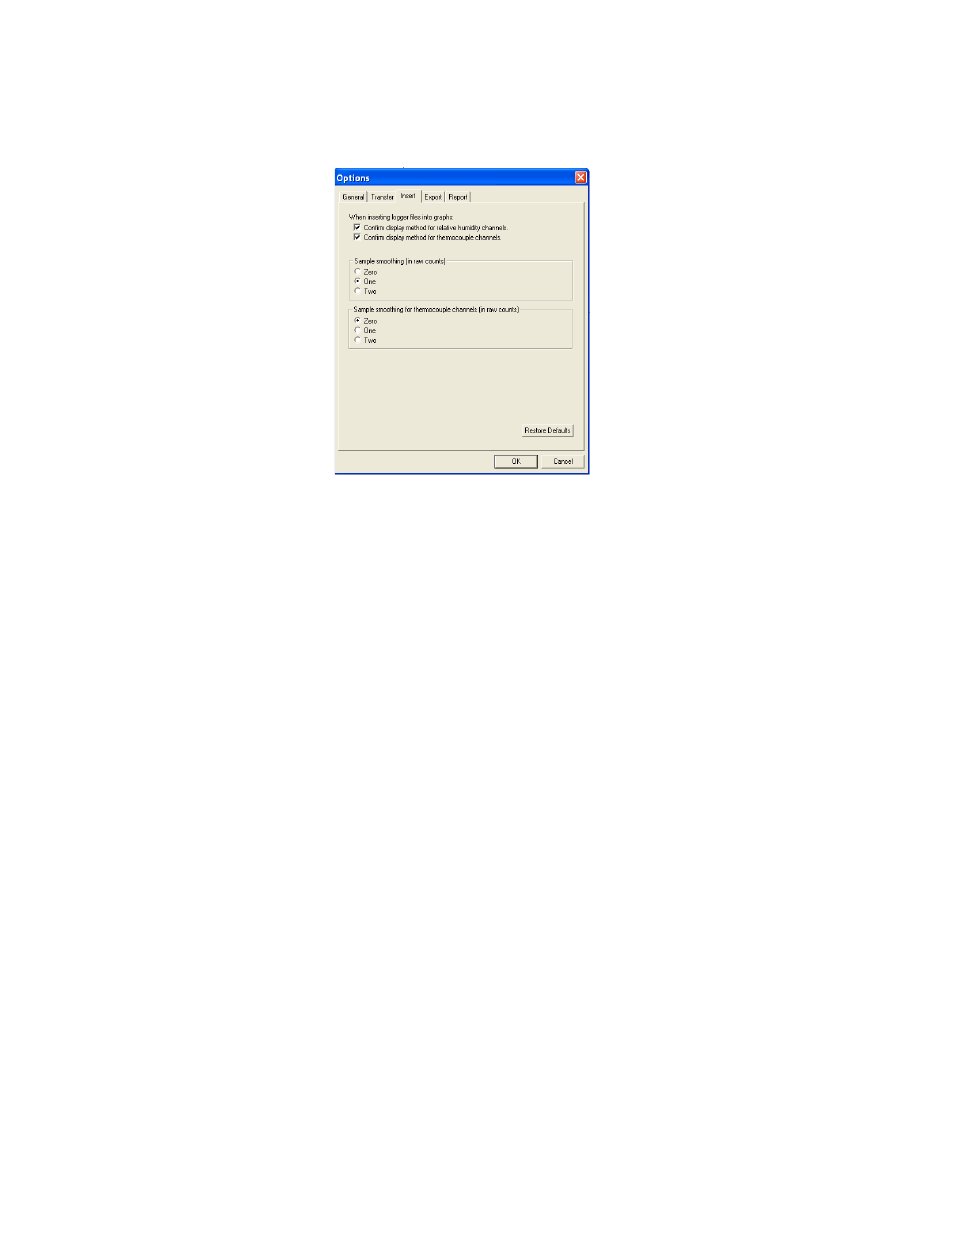
To set sample smoothing:
1. Select Tools>Options, then choose the Insert tab.
2. Under Sample smoothing (in raw counts), select one of the following op-
tions.
3. Click OK.
Displaying Line Numbers on Graphs
Spectrum displays the lines on graphs in different colors. If desired, you can
add numbers to the lines in the graph.
Zero
Produces the most responsive graph, but makes
the recorded readings susceptible to noise
One (default)
Suitable for most applications
Two
Decreases input noise and produces a more sta-
ble graph