Vaisala Spectrum 4.0 User Manual
Page 13
Veriteq Spectrum 4.0 User’s Guide
7
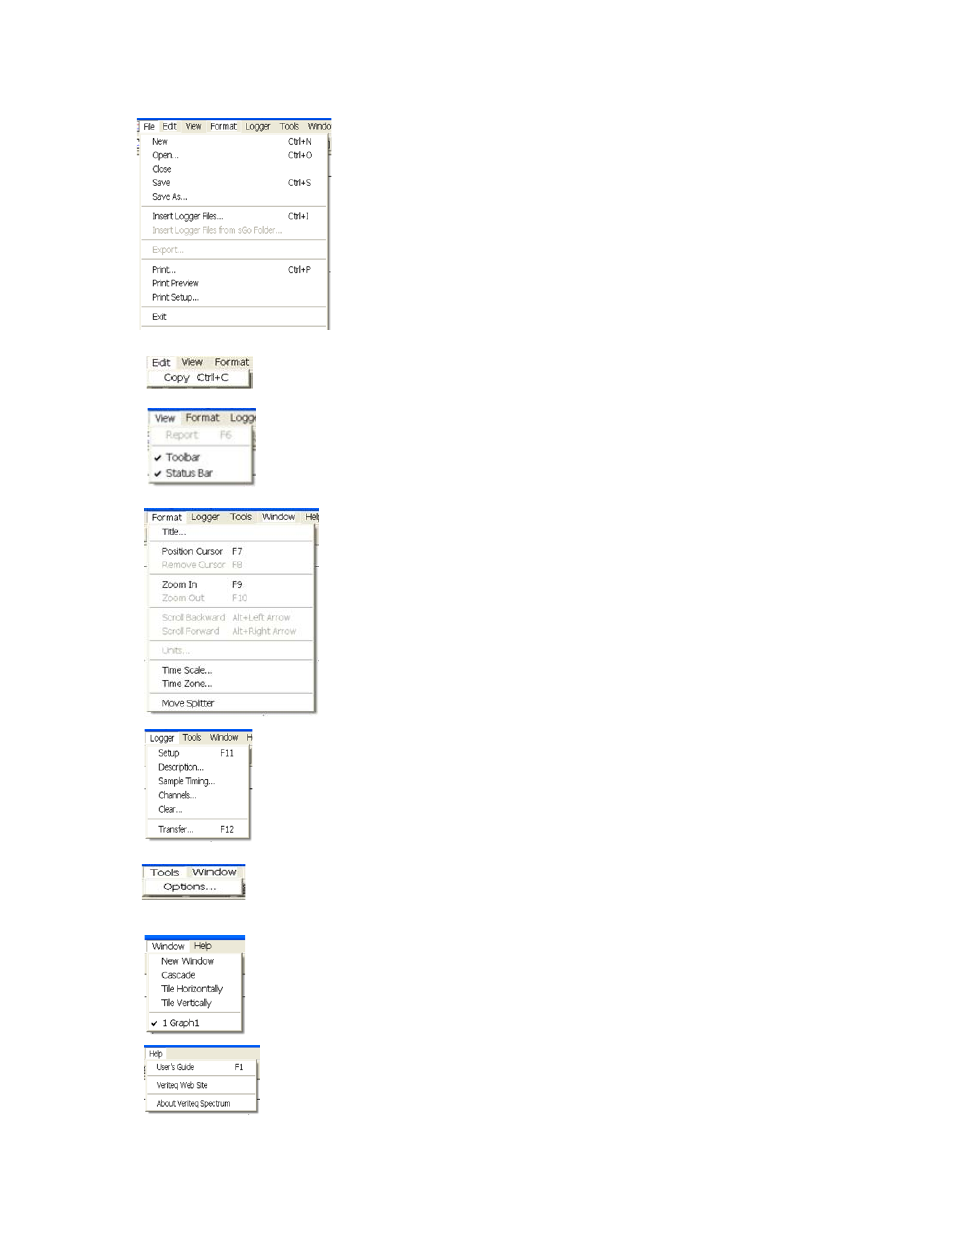
Create a new blank Graph file (.spg)
Open an existing Graph file (.spg)
Save the Graph file
Close the Graph file
Save the Graph file under a different name
Insert a Logger file (.spl) into an open Graph file
View a preview of the printed Graph file
Show or hide the Toolbar
Produce a report associated with the active Graph file
Change the title that appears above the graph
Position the cursor on the graph
Remove the cursor from the graph
Zoom in to enlarge a portion of the graph
Zoom out
Scroll the graph to the left
Scroll the graph to the right
Change the time zone
Move window split line to change view of data and graph proportion
Open the Logger Setup window
Change the logger description
Change the logger sample timing
Enable or disable channels
Clear the data stored in the data logger
Set Spectrum options such as temperature scale, file name formats, export options, etc.
Open a copy of the active graph in a new window
Arrange open windows in a cascade
Tile open windows vertically
Tile open windows horizontally
Switch to another open window
Open a PDF version of this User’s Guide
Go to the Veriteq Instruments web site
View information on this version of Spectrum software
Change the units on the Y-axis of the graph
Transfer information from the data logger to your PC
Change the time scale on the X-axis of the graph
Copy contents of graph to Clipboard.
Print the Graph file
Change the settings on the printer
Insert a Logger file from sGo into an open Graph file
Exit Spectrum software
Export the Graph file
Show or hide the Status Bar