Graph panel – HP XP RAID Manager Software User Manual
Page 166
Description
Item
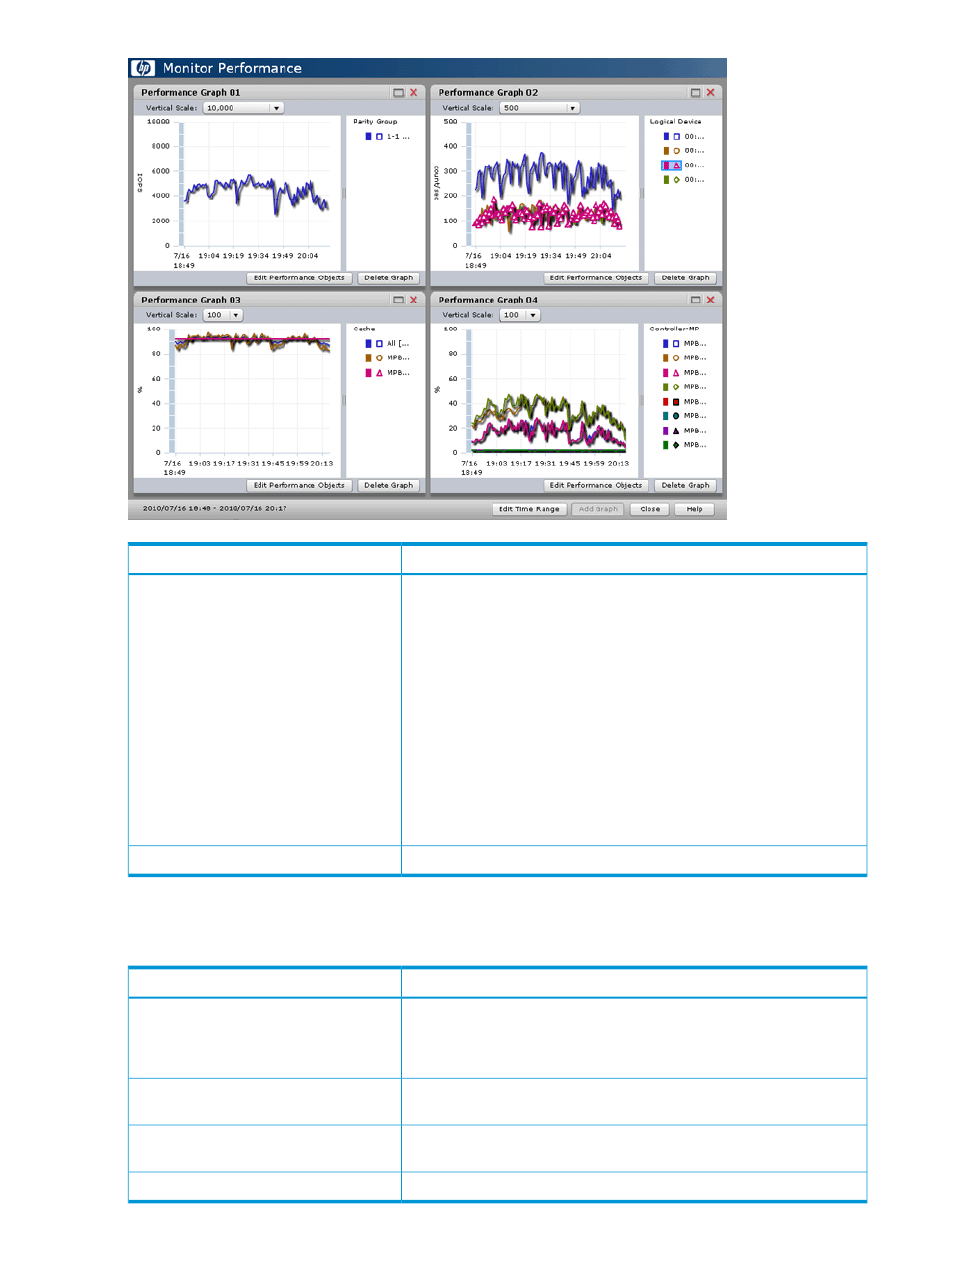
Shows line graphs. The line graph is displayed at the left of the graph
panel, and explanatory notes are displayed at the right of the graph panel.
Following operations can be performed.
Graph panel
•
If you locate the mouse cursor to each point of the graph, a detailed
value is displayed with the tool tip.
•
When you click the explanatory note on the right of the graph panel,
you can display or hide points on the graph panel. However, if the
graph displays only one point on the X axis, the graph is always
displayed on the screen. In this case, the graph cannot be displayed
by clicking the icon that is displayed in the explanatory notes.
•
Up to eight graphs can be displayed in one graph panel.
•
Line graphs can be displayed up to 16.
•
Graph panels can be displayed up to four.
Shows graph panels.
Graph display area
Graph panel
Shows line graphs of monitored objects.
Description
Item
By using the list on the upper left of the graph screen, adjust the scale to
display the maximum value of the graph. If the graph is too big, the display
Vertical Scale:
may not be able to displaying properly. For example, the line of the graph
is too thick, or the graph panel is painted out in the color of the graph.
The graph panel can be maximized or minimized if you click the button
in the upper right of the graph panel.
The button in the upper right of the graph
panel
Opens the Edit Performance Objects window where you can change the
objects to be monitored.
Edit Performance Objects
Deletes the graph panel.
Delete Graph
166 Performance Monitor GUI reference