Chapter five - scsi bridge electronics, 6 initial lcd – HP Integrity NonStop H-Series User Manual
Page 28
Chapter Five - SCSI Bridge Electronics
Tandem 5142-xSE Rackmount Tape Subsystems User Guide
1 8
5.5
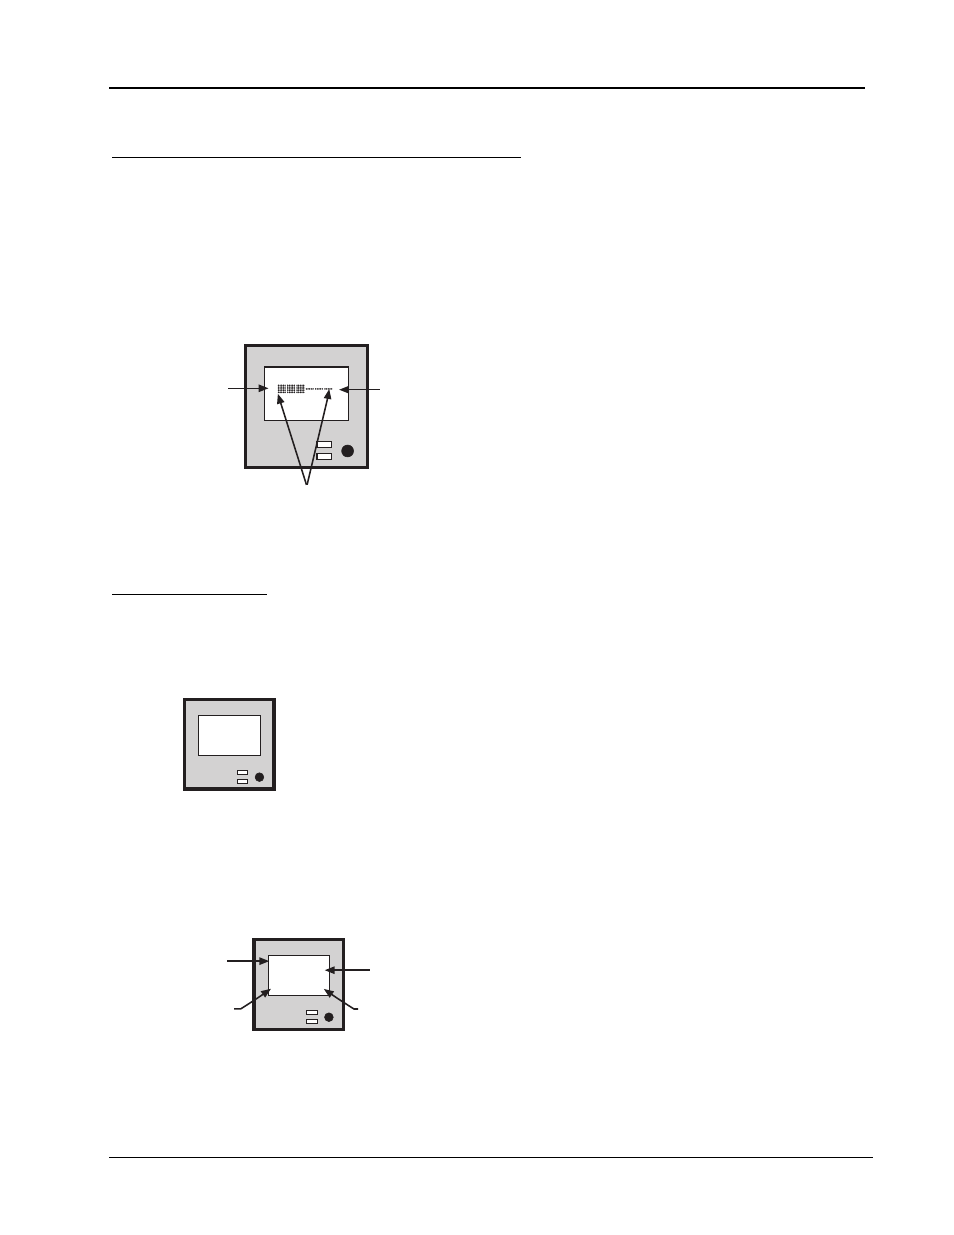
Understanding the Capacity Bar Graph
The capacity bar graph dynamically tracks remaining and consumed capacities. It updates
dynamically during read and write operations. Beginning with the native capacity of the cartridge,
as reported by the tape drive after a cartridge is loaded, Infourmm applies the then current average
compression ratio (if any), computes the then current maximum capacity, and displays the bar
graph by incrementing the appropriate number of vertical bars between the empty icon and the full
icon. There are thirty such vertical bars, each equating to approximately 3.33% percent of total
capacity.
Read
E F
ECC Rate
0.0%
Full Icon
Empty Icon
Capacity
Indicators
Figure 14
Understanding the capacity bar graph
5.6
Initial LCD
After applying power to the subsystem, Infourmm attempts to find the drive at the tape ID.
Typically, tape drives require a few seconds to perform their self-test before they respond;
therefore, the subsystem is not selectable to the host during this period.
InFourmm
========
Power-on
SelfTest
Initial Power-Up Screen
Figure 15
Subsystem's LCD at startup
When the drive is found, the LCD presents the tape-drive ID and firmware level on the top two lines, and
the product name, firmware level and SCSI ID on the bottom two lines. The subsystem is now selectable
to the host as a device occupying the displayed SCSI ID.
Infourmm's
Firmware
Level
Description and Location of Status Display Items
C1537A
Rev L610
5170
T133BID5
Drive
Product
Identification
Drive
Firmware
Level
SCSI ID
Figure 16
Identification of subsystem's LCD items