Alicat Flow Vision SC User Manual
Page 29
29
Charting
To begin charting, access the Chart module to see your chart in the list of
available charts.
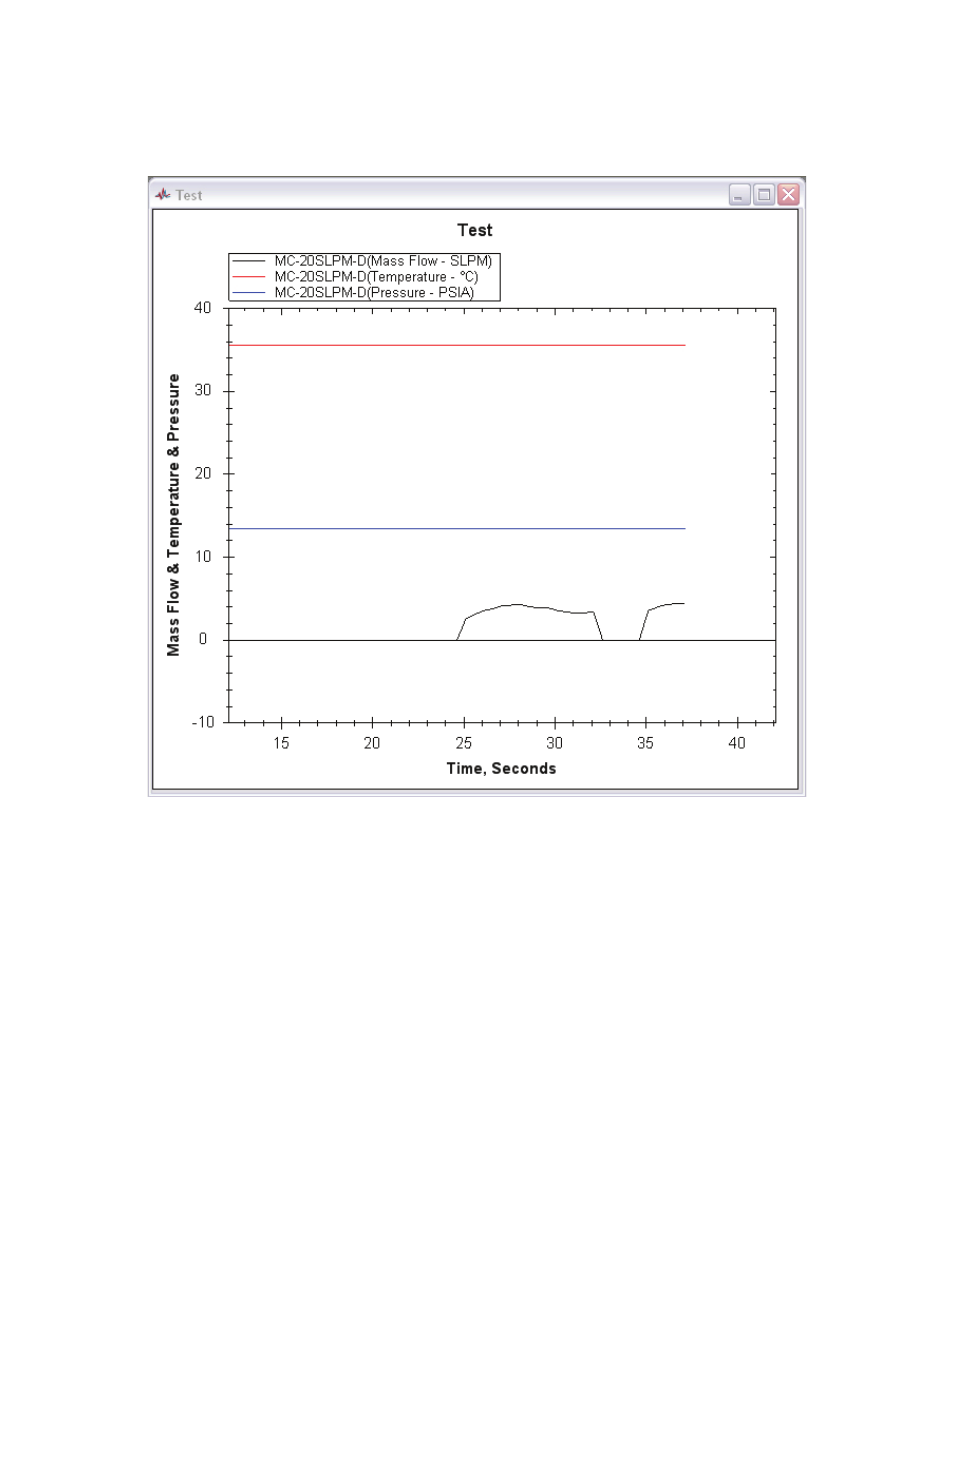
Double click on your chart and it will bring up a window charting your selected series.
Charting is done based on units of time in seconds. The Y axis will scale
according to the parameter with the largest integer measurement. In this case,
it is temperature.
Please note: You cannot save/export a chart setting. Once the chart is removed
from the Chart module, it will need to be redone if you would like to chart the
same series.
The Chart module will allow you to modify an existing chart using the “Modify”
button or to delete an existing chart by using the “Remove” button.
You can also “Refresh” the list if a previously added chart does not appear on
the list.