GW Instek GRF-3300 Series Student Manual User Manual
Page 3
16 Microstrip Line Filters
3
311
The transmission line is often represented as shown in Figure 16-1.
)
,
( t
z
i
)
,
( t
z
v
z
z
'
Figure 16-1, voltage and current definitions of a transmission line
In Figure 16-1, the voltage and current are not only functions of t (time) but also
functions of z (position), which means the voltage and current will change at different
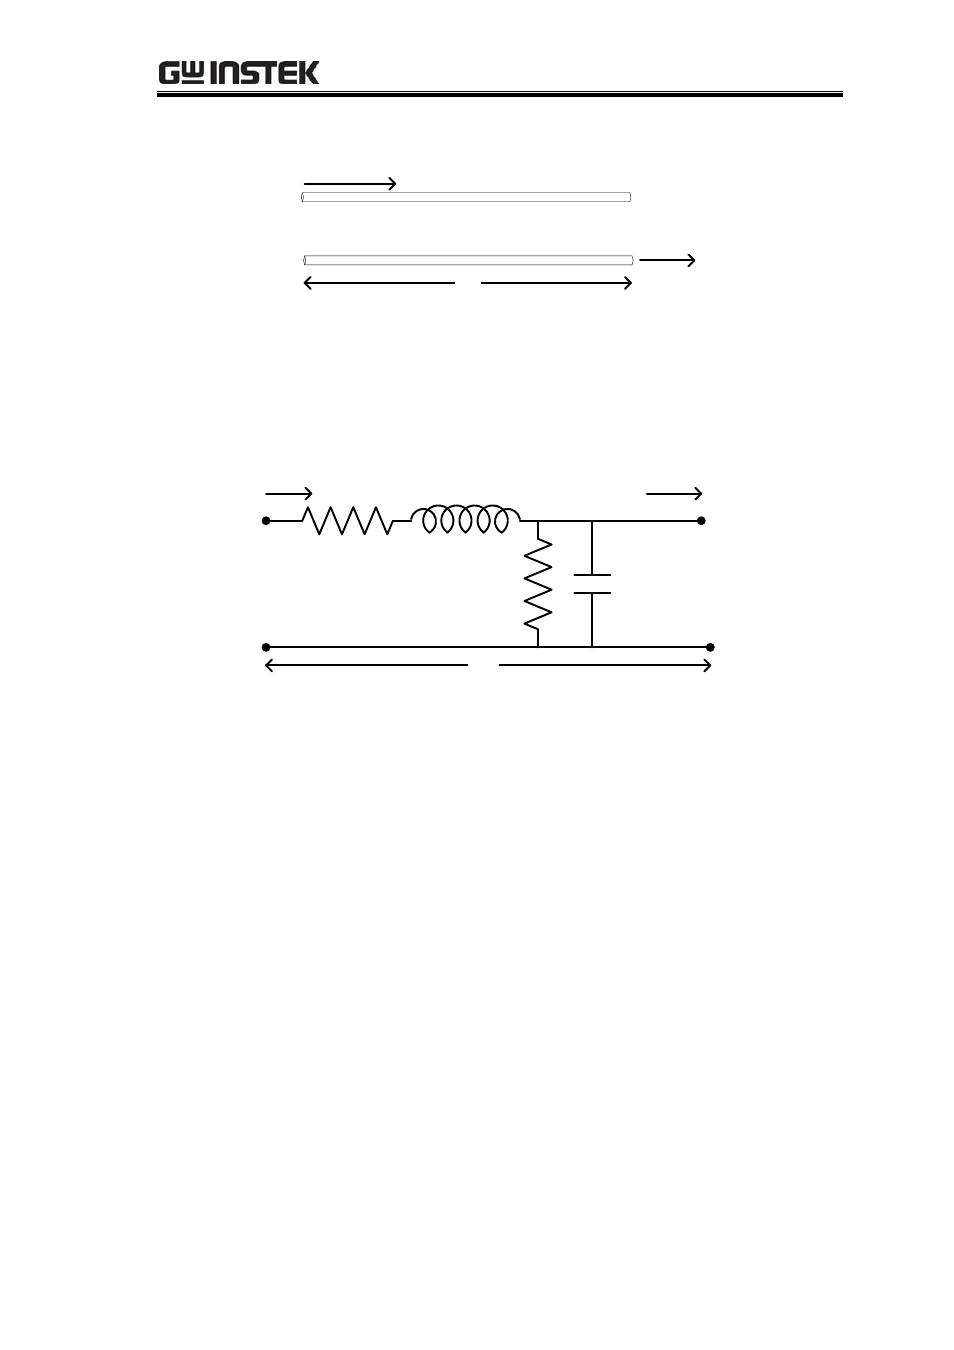
positions (different spots of Z- axis). The equivalent circuit is shown in Figure 16-2.
)
,
( t
z
i
)
,
( t
z
v
z
'c
z
G
'
z
L
'
z
R
'
z
C
'
)
,
(
t
z
z
v
'
)
,
(
t
z
z
i
'
Figure 16-2, equivalent circuit of a transmission line
x
R=series resistance per unit length, for both conductors, in
:/m.
x
L=series inductance per unit length, for both conductors, in H/m.
x
G=shunt conductance per unit length, in S/m.
x
C=shunt capacitance per unit length, in F/m.
The series inductance L represents the total self-inductance of the two conductors,
while the shunt capacitance C occurs due to the close proximity of the two conductors.
The series resistance R represents the resistance due to the finite conductivity of the
conductors, while the shunt conductance G occurs due to dielectric loss in the material
between the conductors R and G. A finite length of transmission line can be viewed as a
cascade of sections formed as in Figure 16-2.
16-1-1. Wave Propagation on a Transmission Line
From Figure 16-2, we define the traveling wave as:
z
O
z
O
e
V
e
V
z
V
J
J
)
(
(16-1)