Performance data, Temperature rise and pressure drop graph, Airflow (cfm) – Sterling TD User Manual
Page 5
5
PERFORMANCE DATA
Table 2 - Tubular Duct Furnace Performance Data
INPUT
OUTPUT
(Max.)
(Min.)
Min.
Temp. Rise
P.D.
Max.
Temp. Rise
P.D.
UNIT
MBH
MBH
MBH
CFM
Deg. F
in. W.C.
CFM
Deg. F
in. W.C.
SIZE
(kW)
(kW)
(kW)
(cu. m/s)
(Deg. C)
(kPa)
(cu. m/s)
Deg. C
(kPa)
100
100
50
82
758
100
0.07
2528
30
0.65
(29.3)
(14.6)
(24.0)
(0.357)
(56)
(0.017)
(1.193)
(17)
(0.16)
150
150
75
123
1137
100
0.03
3792
30
0.44
(43.9)
(21.9)
(36.0)
(0.536)
(56)
(0.007)
(1.789)
(17)
(0.11)
200
200
100
164
1517
100
0.04
5057
30
0.54
(58.6)
(29.3)
(48.0)
(0.715)
(56)
(0.009)
(2.386)
(17)
(0.13)
250
250
125
205
1896
100
0.08
6321
30
0.76
(73.2)
(36.6)
(60.0)
(0.894)
(56)
(0.019)
(2.983)
(17)
(0.19)
300
300
150
246
2275
100
0.03
7585
30
0.69
(87.8)
(43.9)
(72.0)
(1.074)
(56)
(0.007)
(3.579)
(17)
(0.16)
350
350
175
287
2654
100
0.07
8849
30
0.76
(102.5)
(51.2)
(84.1)
(1.252)
(56)
(0.017)
(4.176)
(17)
(0.19)
400
400
200
328
3034
100
0.08
10,114
30
0.70
(117.1)
(58.6)
(96.1)
(1.431)
(56)
(0.019)
(4.773)
(17)
(0.17)
Ratings are shown for unit installations at elevations between 0 and 2,000 feet (610m). For unit installations in U.S.A. above 2,000 feet
(610m), the unit input must be fi eld derated 4% for each 1,000 feet (305m) above sea level; refer to local codes, or in absence of local codes,
refer to the latest edition of the National Fuel Gas Code, ANSI Standard Z223.1 (NFPA 54). For installations in Canada, any references to
deration at altitudes in excess of 2,000 feet (610m) are to be ignored. At altitudes of 2,000 to 4,500 feet (610 to 1372m), the unit must be fi eld
derated and be so marked in accordance with the ETL certifi cation. See Table 7A for U.S.A. and Canadian fi eld deration information.
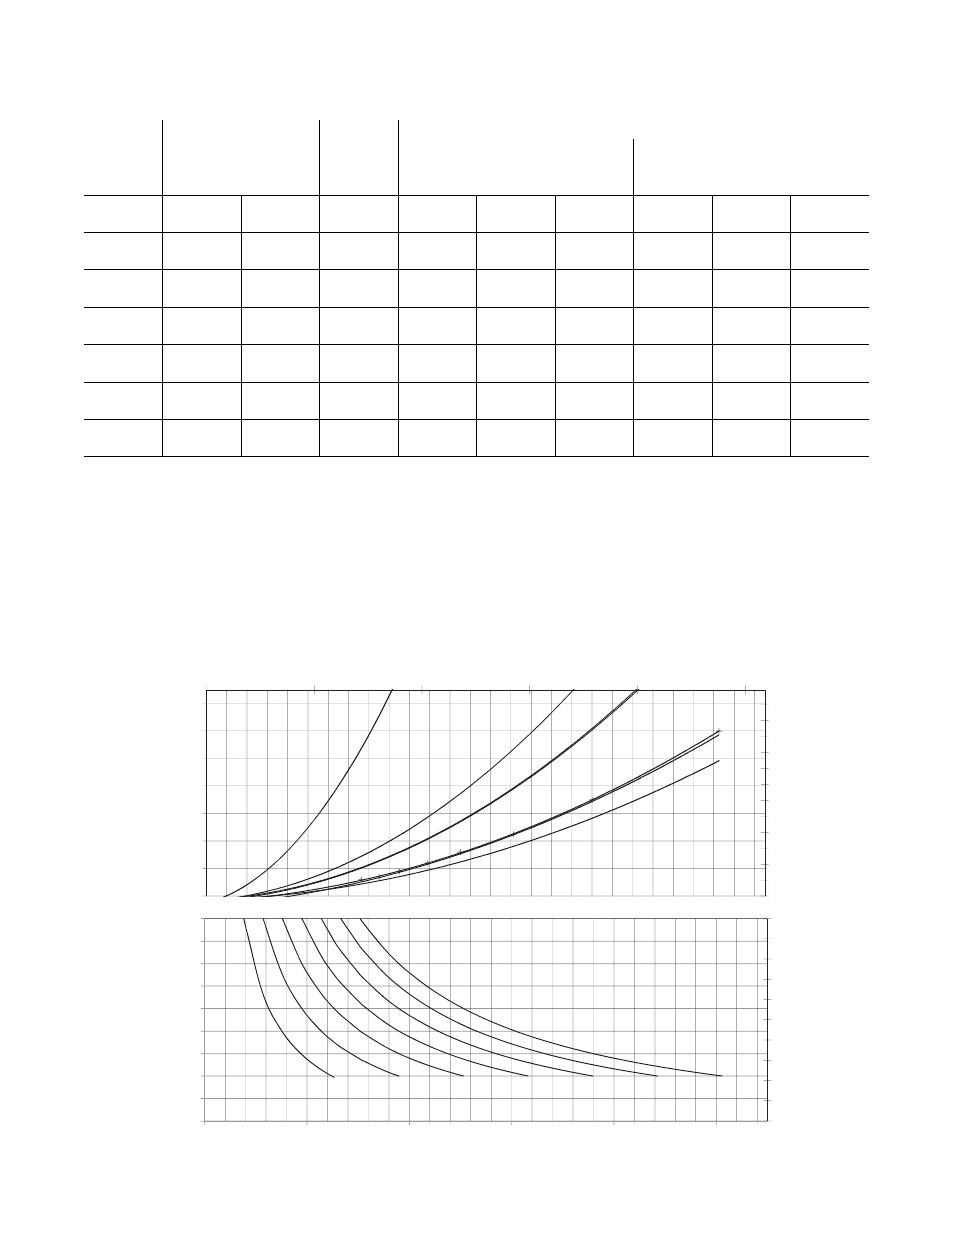
Figure 2
Size 200
Size 250
Size 300
Size 350
Size 400
Size 150
Size 100
0
25
50
75
100
125
150
175
200
225
250
275
300
0
1
2
3
4
5
0
0.2
0.4
0.6
0.8
1
1.2
1.4
Pa
m
3
/s
Pressure Drop,
i
n
ches
W
.C.
Temperature Rise and Pressure Drop Graph
Size 150
Size 200
Size 250
Size 300
Size 350
Size 400
Size 100
6
11
16
21
26
31
36
41
46
51
56
10
20
30
40
50
60
70
80
90
100
0
2000
4000
6000
8000
10000
°C
T
e
mperature R
ise,
°
F
Airflow (CFM)