Operation of exaxt ph450g, 1. main display functions, 2. trending graphics – Yokogawa EXAxt PH450 4-Wire Analyzer for pH and ORP User Manual
Page 27: 3. zoom in on details, 3-1. actual ma1, 3-2. actual ma2, 3-3. zero, Next
19
IM 12B07C05-01E
4
OPERATION
OF
EXAxt
PH450G
4-1. Main display functions
T ag:EXAxt PH45 0
HOLD
W AS H
25.0
236.0 mV
S4
S3
S2
S1
Go to trend screen
Go to zoom screen
Go to status screen
Go to maintenance screen
Figure 4-1. Main Display
A heart “ ” mark is lit on the right-upper corner of the
screen when HART communication is active. An “Χ”
mark is lit when HART communication is abnormal.
Nothing appears when HART communication is not
used.
Note that the “Χ” mark may appear due to output
signal noise or the like even when HART communica-
tion is not used. There is not problem when HART
communication is not used. Continue operation while
ignoring the mark.
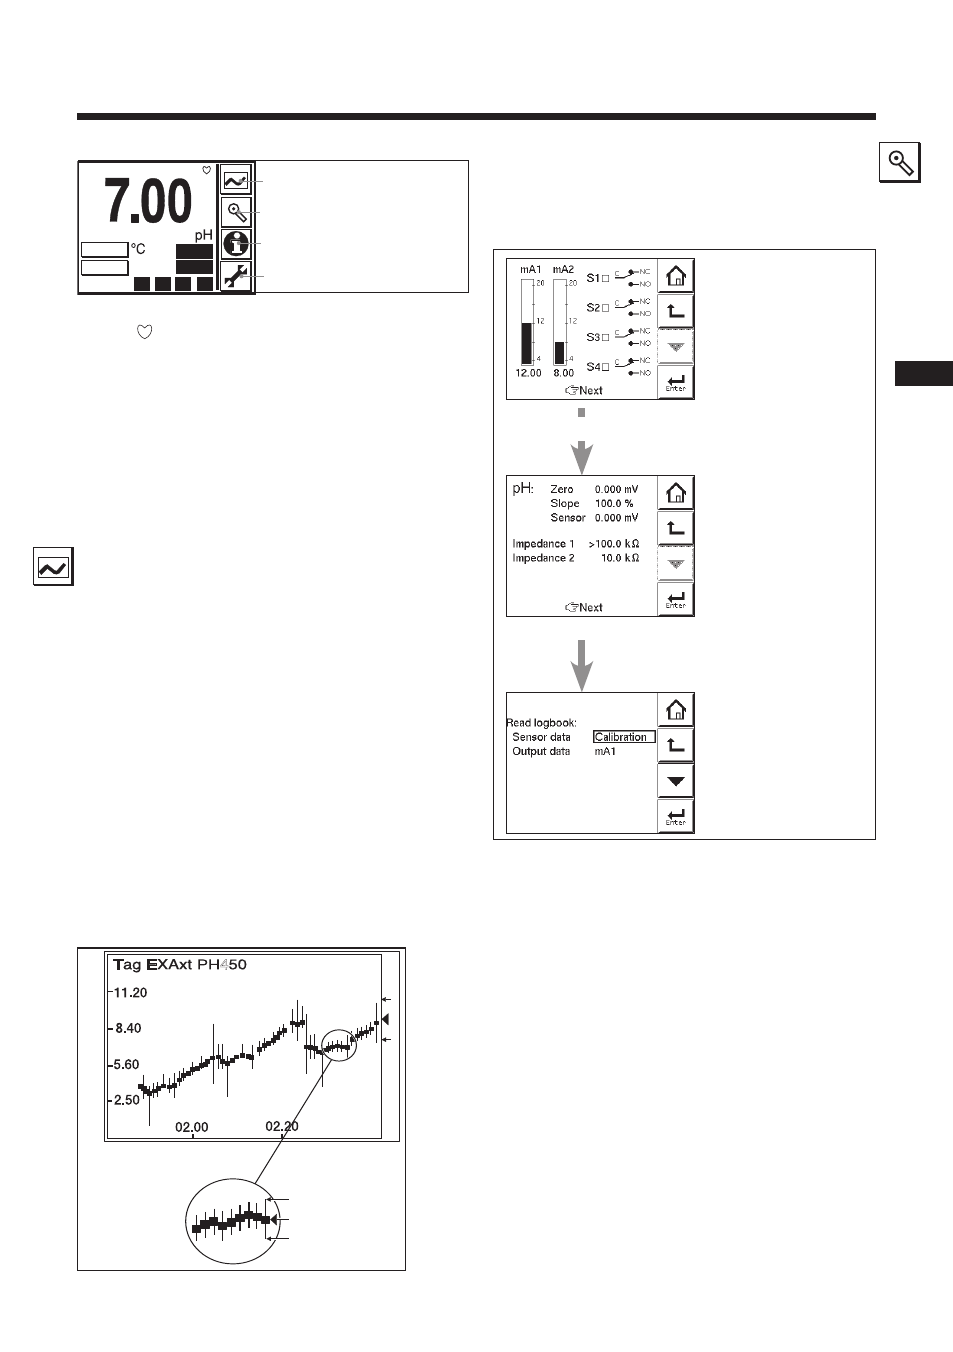
4-2. Trending graphics
Pressing the button changes the display
into a graphical mode in which the average
measured value is shown on a time scale. The
“Live” value is also digitally displayed in a text
box. The time scale ( X-axis) and the primary
value scale (Y-axis) are set in the “DISPLAY
SETUP” menu. The full screen displays a trend
of 51 points that represent the average of the
selected time interval. The converter samples
the measurement every second. The trending
graphic also shows the maximum and minimum
measured value in that interval.
For example if the time scale is set to 4 hours,
then the trend is shown for 4 hours prior to the
actual measurement. Each point on the trend
line represents the average over 4*60*60/51 =
282 measurements (seconds).
Maximum
Minimum
Minimum
Maximum
Average
Live reading
9.10 pH
4
Figure 4-2. Trend screen
4-3. Zoom in on details
This button gives access to the diagnostic
information of the converter. The following
messages will appear under normal (default)
conditions:
- Home key back to
mainscreen.
- One level up.
- Scroll choices
(grey
means deactivated).
- Enter selected data
or choice.
First zoom screen
gives you inside
into the parameters
involving current
measurement. All
following zoom
screens give
additional information
about the device and
lead to logbook data.
Next
Next
Next
Next
Figure 4-3. Detail screen
4-3-1. Actual mA1
= the current output in mA of the first current
output, which is defined as mA1. The range
and function of this mA output can be set in
Commissioning >> Output setup>> mA1
4-3-2. Actual mA2
= the current output in mA of the second
current output, which is defined as mA2. The
range and function of this mA output can be
set in
Commissioning >> output setup >> mA2
4-3-3. Zero
= calibrated sensor offset in mV. Theoretically
the sensor reads 0 mV in a buffer solution with
the same pH value as the Iso po ten tial pH value
4. OPERATION OF EXAxt PH450G
T
-->
pH
--
>