Device b-h curve test, Bh curve test – Teledyne LeCroy Power Analyzer Package User Manual
Page 18
Power Analysis Software
Device B-H Curve Test
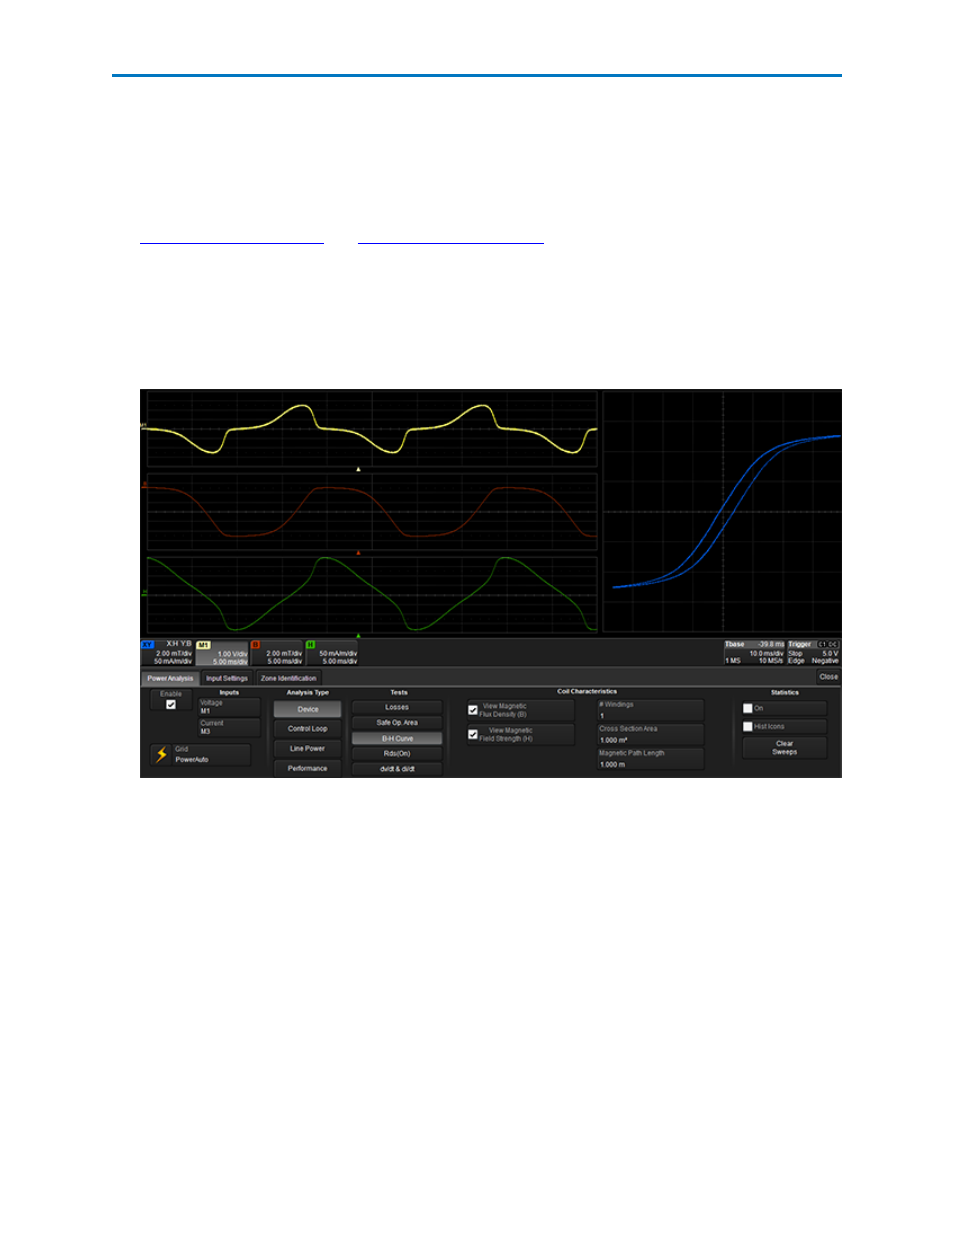
This test displays the B-H hysteresis plot that confirms the saturation status of a magnetic device. The
voltage across a waveform, typically acquired with a differential voltage probe, is set as the voltage
source. The current through the device is captured typically with a current probe. The hysteresis plot is
presented as the integrated voltage across the magnetic device versus the current through the device.
1.
and
2. On the Power Analysis tab choose Analysis Type Device and Test B-H Curve.
The scope display shows the voltage source before it is integrated, the current source, and the hys-
teresis plot.
3. Select to View Magnetic Flux Density (B) and/or View Magnetic Field Strength (H). Additional res-
ult traces appear for each selection.
4. Optionally, enter the Coil Characteristics in# Wingdings, Cross Section Areaand Magnetic Path
Length. This will set the appropriate scale vales within each of the descriptors. Cursors provide addi-
tional details of the values on specific parts of the B and H waveforms.
5. Optionally, select Statistics to display mean, minimum and maximum values on the measurements
table. This helps to observe a consistent number.
6. Optionally, select Histicons to display a miniature histogram of the statistical measurements.
16
921326 Rev B